From Crypto Chips to Global Money Rails: How Stablecoins Grew Up
A Growth Story That Isn't Really About Growth
The stablecoin story is often told as one big upward line, but that framing hides what actually happened. There were three distinct phases, each with a different core user, a different value proposition, and a different relationship with regulators.
Each phase followed the same loop: value expanded, risk blew up, regulators responded, and the next phase pushed stablecoins deeper into the real economy. Understanding that pattern explains both how far stablecoins have come and why the journey is far from over.
Chart 1: Stablecoin three-stage evolution concept map
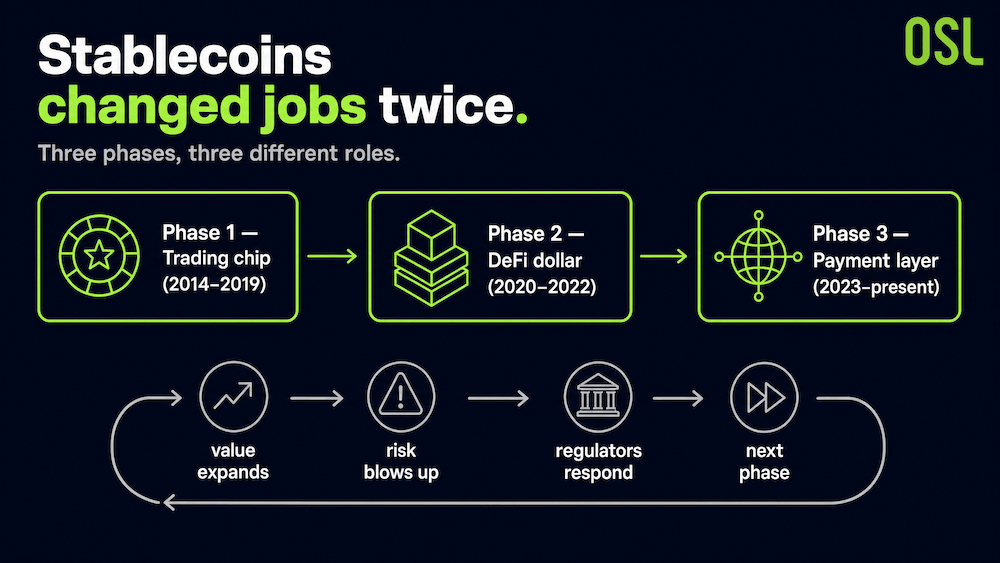
Phase One (2014–2019): The Trading Chip
Stablecoins were born inside crypto exchanges. In July 2014, a project called Realcoin launched; it was soon renamed Tether. On 6 October 2014, the first 100 USDT were minted on the Omni Layer.
The value proposition was narrow: a dollar-equivalent unit that traders could hold and move without a bank account, entirely inside the exchange ecosystem. The growth tracked the crypto market closely. During the 2017 bull run, USDT's market cap jumped from roughly $10 million to around $1.5 billion. It was not an independent financial product. It was a byproduct of trading activity, and it lived in a regulatory vacuum.
Phase Two (2020–2022): The DeFi Dollar
2020 changed the job description. As decentralised finance protocols exploded, stablecoins stopped being parked cash and became the core liquidity layer of DeFi. They were collateral, trading-pair base assets, and the settlement unit across protocols.
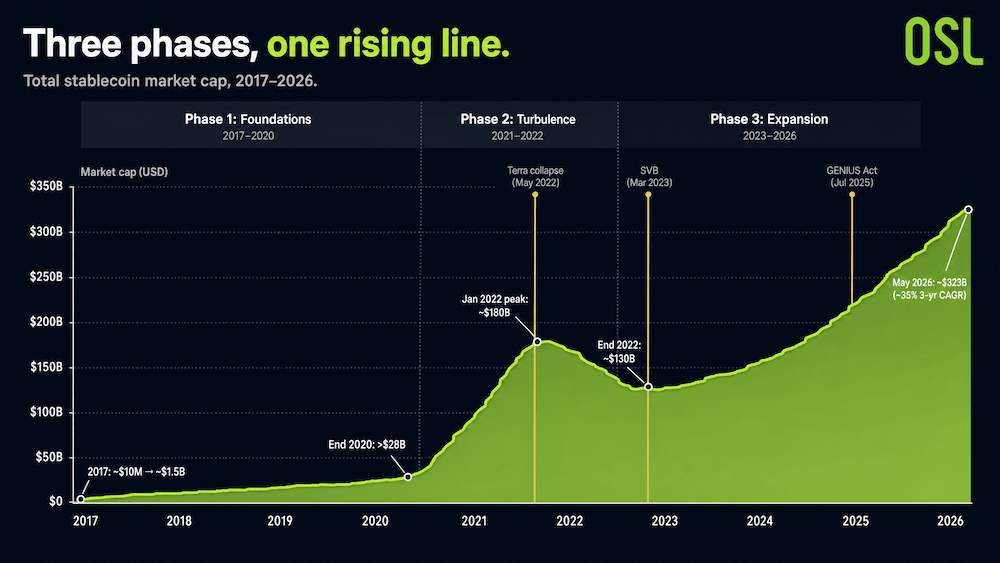
The scale shift was dramatic. Total stablecoin supply went from under $5 billion at the start of 2020 to over $28 billion by year-end. It crossed $100 billion in June 2021 and peaked near $180 billion in January 2022.
Then came the lesson. In May 2022, Terra's algorithmic stablecoin UST lost its peg and roughly $50 billion in value evaporated in about 72 hours. The collapse did not kill the industry. It did something more important: it accelerated a consensus that "full fiat reserves + independent audit + compliance" was the only durable model. The March 2023 collapse of Silicon Valley Bank reinforced the point, narrowing the market's definition of "safe reserves" to short-term Treasuries, overnight repo, and government money funds.
Phase Three (2023–Present): The Payment Layer
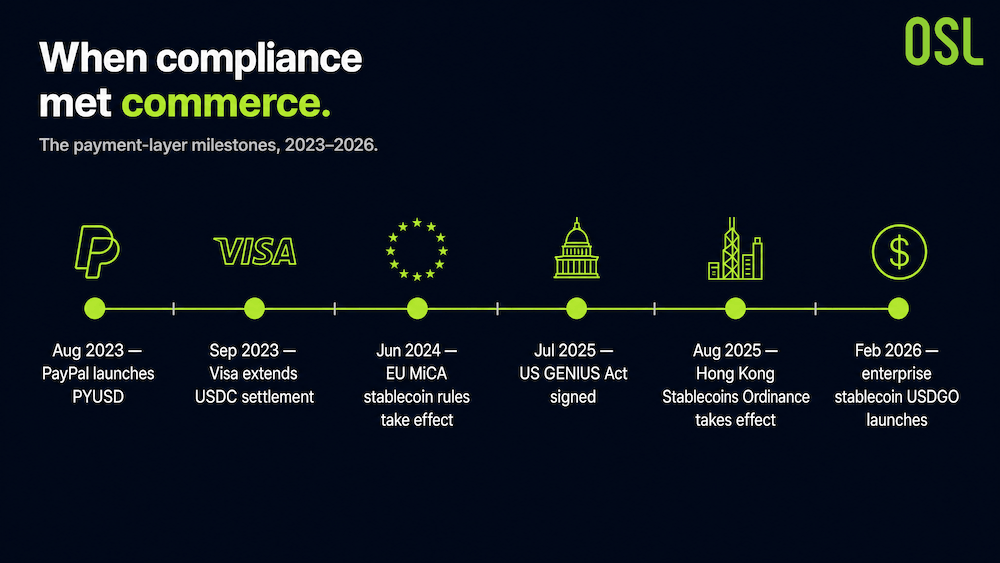
From 2023, stablecoins began crossing from crypto markets into real trade. The milestones came quickly: PayPal launched PYUSD (August 2023), Visa extended USDC settlement (September 2023), the EU's MiCA stablecoin rules took effect (June 2024), the US GENIUS Act was signed (July 2025), Hong Kong's Stablecoins Ordinance took effect (August 2025), and the enterprise stablecoin USDGO launched (February 2026).
Chart 2: Stablecoin payment layer milestone time
This is the first phase where commercial logic and compliance are deeply combined, and it is the one that gives stablecoins a real shot at becoming global trade infrastructure. The scale recovered accordingly: from a post-Terra low of around $130 billion at the end of 2022, total stablecoin market cap climbed to roughly $323 billion by May 2026, a compound growth rate of about 35% over three years.
Chart 3: The three-phase market cap trajectory (2017–2026)
Source:Report: The Liquidity Hub of the Digital Economy (OSL × HKPU Faculty of Business)
The Numbers Today: Big, and Still Tiny
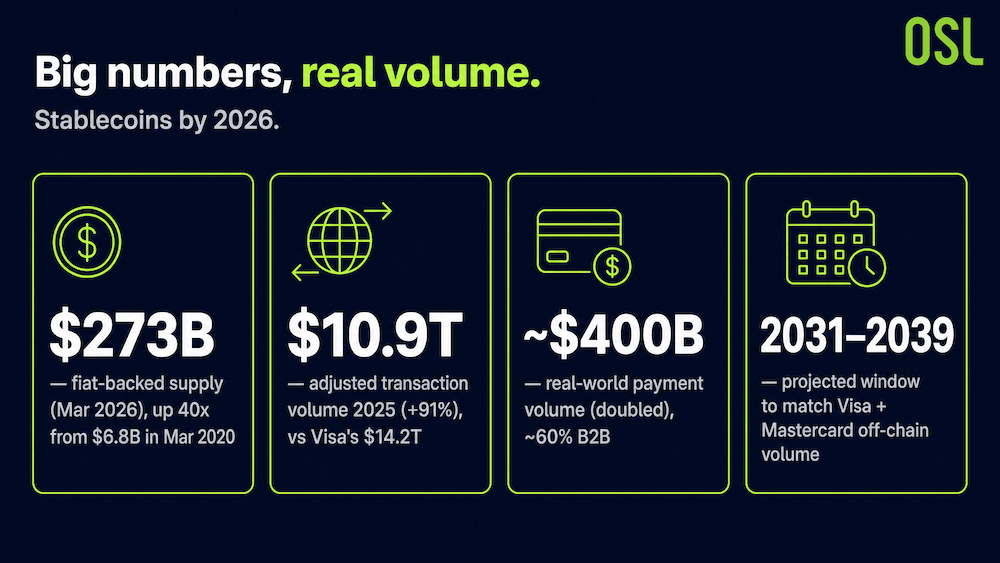
By 2026 the headline figures are striking. According to Bessemer Venture Partners, fiat-backed stablecoin supply topped $273 billion in March 2026, up 40x from $6.8 billion in March 2020. Adjusted transaction volume grew 91% in 2025 to $10.9 trillion, rivalling Visa's $14.2 trillion in annual payments. Real-world payment volume doubled to roughly $400 billion, about 60% of it B2B.
Chainalysis projects that stablecoin payment volumes could match the combined off-chain volumes of Visa and Mastercard somewhere between 2031 and 2039, and frames that as a "countdown" for incumbents.
Chart 4: 2026 stablecoin key data card
Source:Bessemer Venture Partners, Chainalysis
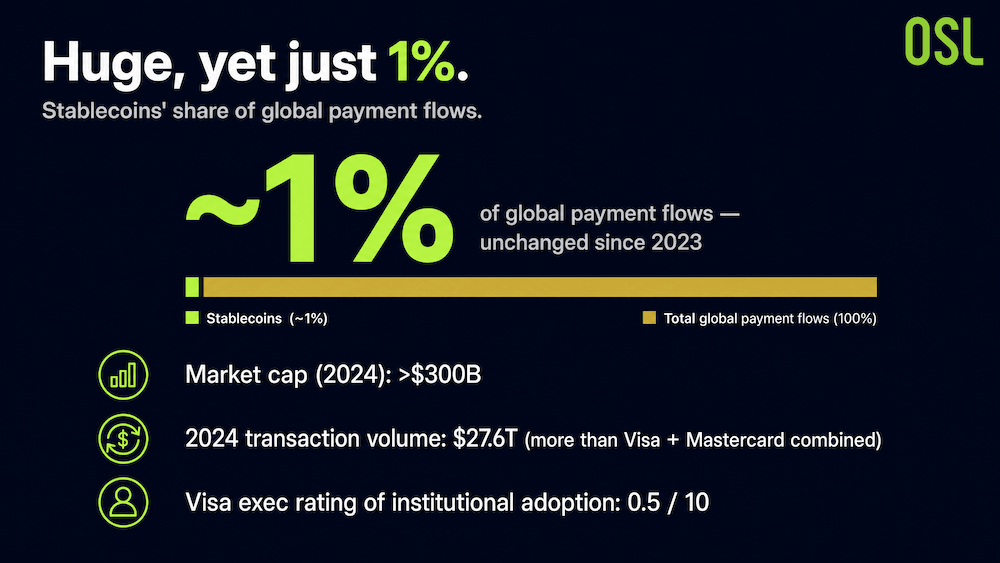
And yet, here is the paradox.
According to OpenFX's 2026 report, stablecoins still account for just 1% of global payment flows, the same share as in 2023 and 2024. That is despite a market cap above $300 billion and 2024 transaction volume of $27.6 trillion, more than Visa and Mastercard processed combined, and despite Visa executives rating institutional adoption at just 0.5 out of 10. The binding constraint here is infrastructure rather than technology: on-ramps and off-ramps, compliance checks, and reconciliation. The blockchain solved fast settlement years ago. Everything around it is still catching up.
Chart 5: Stablecoin 1% paradox diagram
Source:OpenFX's 2026 report
What the Three Phases Tell Us
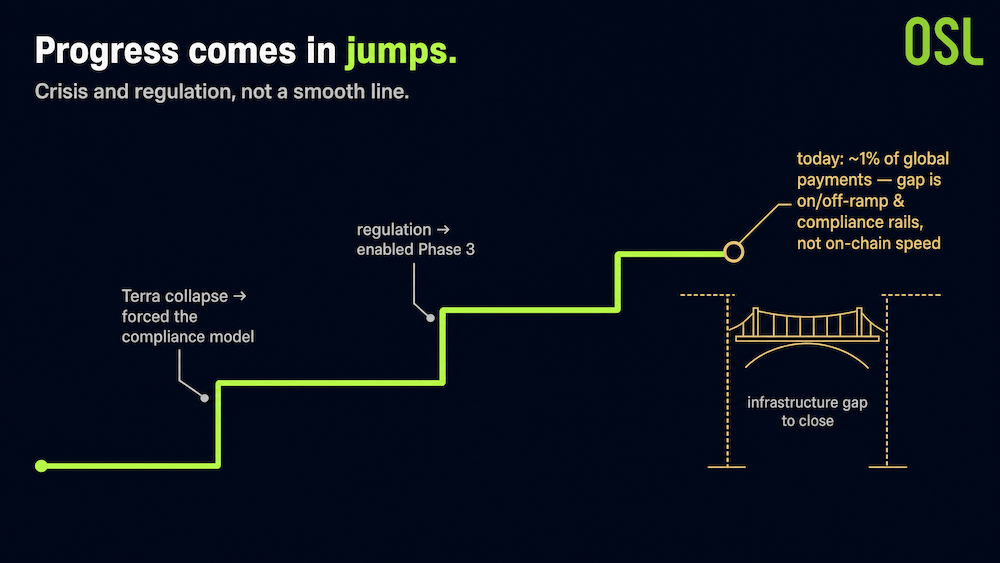
The pattern is consistent. Stablecoins advance in jumps triggered by crisis and regulation rather than along a smooth curve. The Terra collapse did not end stablecoins; it forced the compliance model that made Phase Three possible. The next jump depends less on raw on-chain capability and more on closing the infrastructure gap that keeps stablecoins at 1% of global payments.
For anyone tracking where this goes, the market cap is less telling than the trajectory of real-world payment volume. The number to watch is whether that volume, today a small slice of the total, keeps compounding as on/off-ramp and compliance rails mature.
Chart 6: Stablecoin ladder transition concept map
FAQ
Q1: When was the first stablecoin created? A: The first commercially significant fiat-backed stablecoin, USDT, was minted on 6 October 2014 on the Omni Layer, by the project originally called Realcoin (later Tether).
Q2: What were the three phases of stablecoin evolution? A: Phase 1 (2014–2019) trading chip inside exchanges; Phase 2 (2020–2022) core liquidity layer of DeFi; Phase 3 (2023–present) compliant payment infrastructure for global trade.
Q3: How big is the stablecoin market in 2026? A: Around $323 billion in total market cap as of May 2026, with 2025 adjusted transaction volume near $10.9 trillion.
Q4: If stablecoins are so big, why do they clear only 1% of global payments? A: The constraint is infrastructure, not technology, on/off-ramps, compliance, and reconciliation, rather than on-chain settlement speed.
References
Note: This article is an industry analysis based on public sources and the cited report. It is not investment advice.
Start your safe cryptocurrency journey now
OSL | Secure Ramps. Trusted Rails !
More topics
More topics
Latest
Global Remittance Costs at 6%, Africa at 8%: Can Stablecoins Truly Reduce Costs? BIS Offers a Cautious Response
Explore if stablecoins can lower global remittance costs (currently 6%) and their role in solving financial exclusion in orphaned corridors.
Global Remittance Costs at 6%, Africa at 8%: Can Stablecoins Truly Reduce Costs? BIS Offers a Cautious Response
SWIFT Doesn't Actually Move Your Money: How Stablecoins Rebuild B2B Payments
Discover how stablecoins restructure B2B payments, reduce costs by 70%, and solve the $27T trapped liquidity issue in the SWIFT network.
SWIFT Doesn't Actually Move Your Money: How Stablecoins Rebuild B2B Payments
From Crypto Chips to Global Money Rails: How Stablecoins Grew Up
Explore the three stages of stablecoin evolution: from exchange trading chips and DeFi liquidity to becoming global compliant payment infrastructure.
From Crypto Chips to Global Money Rails: How Stablecoins Grew Up
The CFO's Three Problems: How Stablecoins Are Quietly Entering Corporate Treasury
Discover how stablecoins address trapped cash, FX risk, and visibility gaps in corporate treasury through quiet pilots and institutional adoption.
The CFO's Three Problems: How Stablecoins Are Quietly Entering Corporate Treasury
Why is Bitcoin Frequently Mentioned Near the "200-Week Moving Average"? Understanding This Long-Term Indicator
Discover the significance of Bitcoin's 200-week SMA, historical returns, and how to use technical indicators for long-term crypto investing.
Why is Bitcoin Frequently Mentioned Near the "200-Week Moving Average"? Understanding This Long-Term Indicator
Is This Panic Selling Only Half as Intense as Before? Analyzing Bitcoin Market Structure via On-chain Data
Analyze Bitcoin market structure using on-chain data. Learn why the recent sell-off's realized loss is half of the previous round.
Is This Panic Selling Only Half as Intense as Before? Analyzing Bitcoin Market Structure via On-chain Data
Recommended for you
More topics
More topics
