Global Remittance Costs at 6%, Africa at 8%: Can Stablecoins Truly Reduce Costs? BIS Offers a Cautious Response
Introduction: A Number That Has Missed Its Target for Over a Decade
The UN Sustainable Development Goal (SDG 10.c.1) set a target: by 2030, reduce remittance costs below 3% and eliminate every corridor above 5%. In reality, that target has been missed for well over a decade.
The global average all-in cost of sending $200 is still close to 6%, twice the target. In some regions it is worse. This is not simply a question of "technical efficiency"; it is a form of institutional, structural financial exclusion. Stablecoins are often promoted as the cure, but their real impact has clear limits, which the data below unpacks one by one.
1. The Corners "Abandoned" by Correspondent Banks: Where High-Cost Corridors Come From
The root of the problem is the continued shrinking of the global correspondent banking network. The report cites BIS/CPMI and FSB data: the number of active correspondent banking relationships worldwide fell about 25% from its 2011 peak through 2020, with Latin America (excluding North America) down about 30%, and small economies with GDP below $10 billion seeing their average number of foreign counterparty banks plunge about 23%.
The driver is that clearing banks in developed countries, under intense anti-money-laundering (AML) pressure, have systematically "de-risked" high-risk, low-margin emerging-market corridors. The result is what the industry calls "orphaned corridors." In these payment channels abandoned by mainstream banks, cross-border funds pass through more layers of intermediaries and carry steep monopolistic premiums.
Chart 1: Bar chart of orphaned cross-border payment corridors in emerging markets
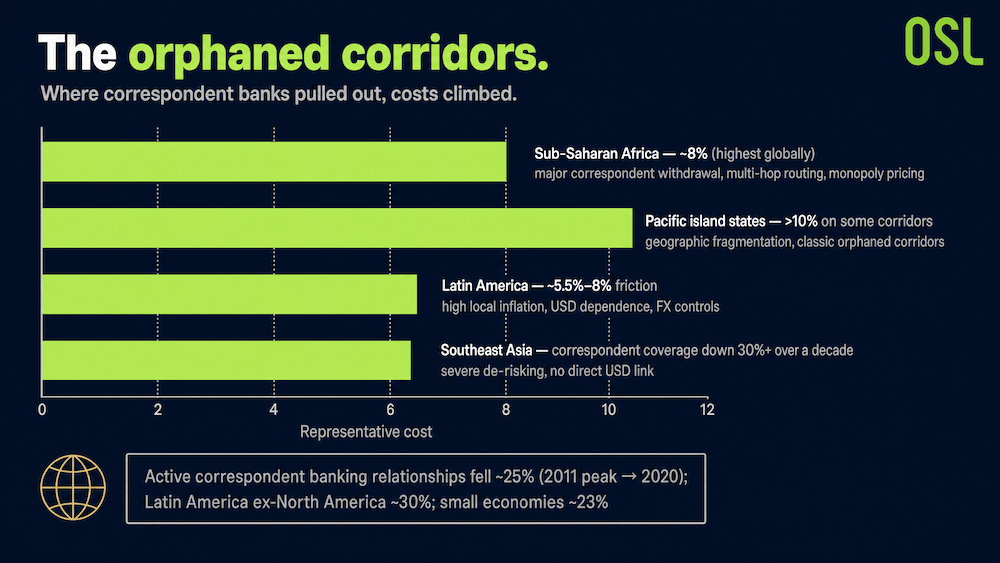
Source: The Liquidity Hub of the Digital Economy
2. The Latest World Bank Data: The Average Is Falling, but the Disparities Are Striking
According to World Bank Remittance Prices Worldwide data (Q1 2026), the global average cost of sending $200 is about 6.0%, slightly down from 6.2% a year earlier. But the "global average" is misleading; it is pulled down by high-volume, low-cost corridors (such as US→India at about 2.5%), masking the real disparities. (Reference compilation: SendMoneyCompare, 2026-03-31)
Chart 2: Cross-border remittance costs: structural imbalance by region and by channel
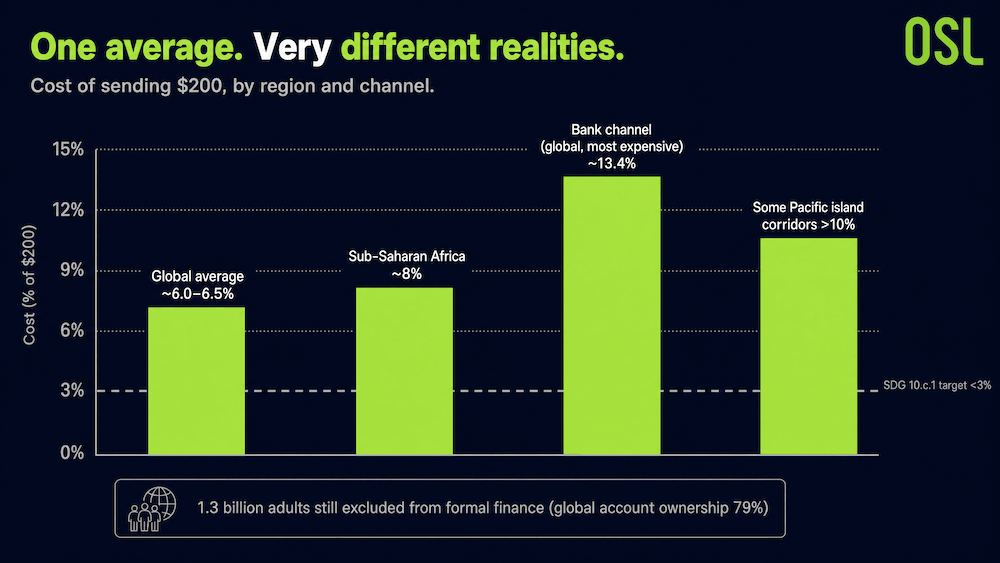
Source: The Liquidity Hub of the Digital Economy
Bank channels are the most expensive way to send money worldwide (about 13.4%); meanwhile 1.3 billion adults remain excluded from the formal financial system (global account ownership of 79%, World Bank Global Findex 2025).
3. The "Real Limits" of Stablecoins: The Cost Is Not On-Chain, but at the "Edges"
Stablecoins are often billed as the end of remittance costs. But viewed with the caution a business school should bring, the evidence is mixed, and that is exactly what is most worth clarifying.
The optimistic side: According to research from the Inter-American Development Bank (IDB) (2026-03-26), dollar stablecoins are increasingly used for family remittances. On the US–Mexico corridor, Bitso reported processing more than $6.5 billion in remittances in 2024, over 10% of the corridor's total volume. The Federal Reserve's FEDS Notes (2026-03-30) also notes that stablecoins can bypass correspondent-banking intermediaries, removing intermediary fees and shortening settlement times.
The cautious side: But according to a Bank for International Settlements (BIS) CPMI speech (2026-05-05), preliminary analysis by the Bank of Italy shows that stablecoin solutions offer no systematic cost advantage; costs vary by corridor and are strongly affected by on/off-ramp fees, reaching as high as 9% in some cases.
The key insight comes from the IDB: a household's "all-in cost" depends more on "edge" costs, namely the FX spread, local cash-out options, bank accessibility, and compliance friction, than on the on-chain fee. In other words, stablecoins optimise the "middle leg" (the on-chain transfer), but the bulk of remittance cost usually sits at the "two ends" (fiat on- and off-ramps).
The real differentiated value of stablecoins is not being "a few cents cheaper than SWIFT," but providing "zero-to-one (0→1)" inclusive access in orphaned corridors that correspondent banks have already left. In mature, fully competitive corridors, their cost advantage does not necessarily hold.
Chart 3: Breakdown of stablecoin remittance costs
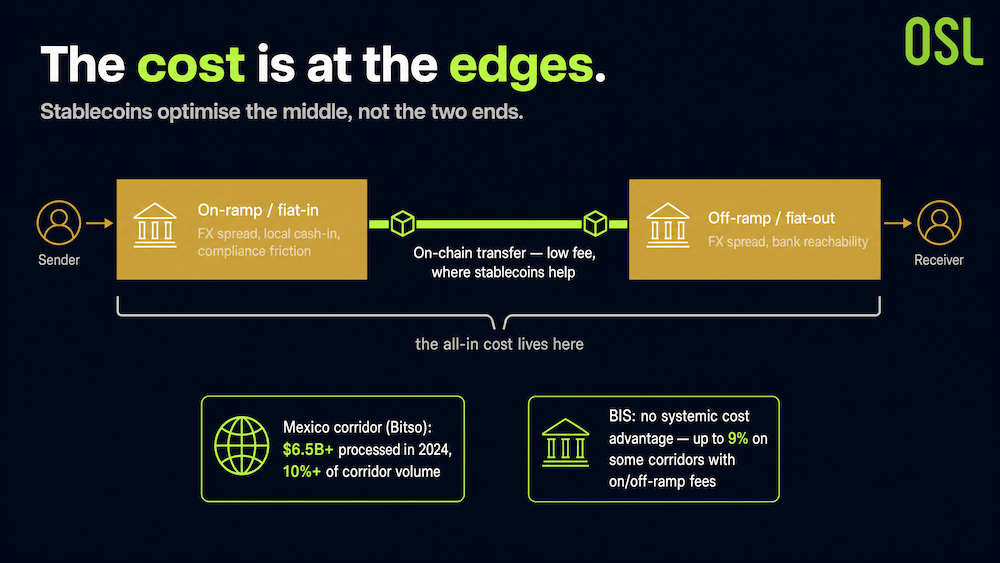
Source: Inter-American Development Bank (IDB) research (2026-03-26), Bank for International Settlements (BIS) CPMI speech (2026-05-05)
4. The Differentiated Value of Stablecoins: A New Paradigm, Not a Tweak to the Old Rails
The report argues that the value of compliant stablecoins should be understood at the "paradigm level" rather than the "efficiency level."
Chart 4: Three-dimensional framework for the differentiated value of compliant stablecoins
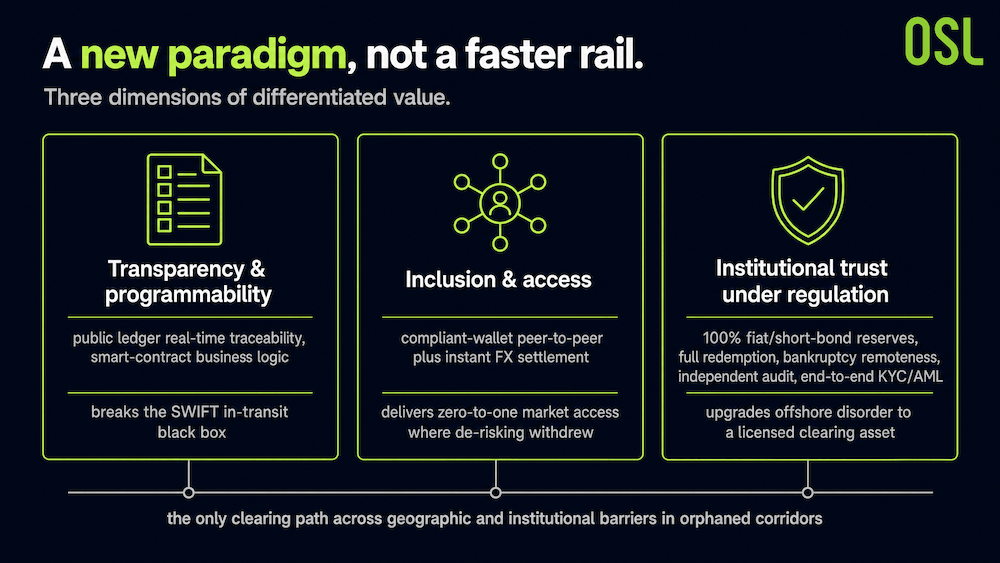
Source: The Liquidity Hub of the Digital Economy
These three dimensions point to a single conclusion: in corridors with severe financial exclusion, compliant stablecoins offer not an "optional convenience" but the only clearing path capable of crossing geographic and institutional barriers to connect global trade flows.
Conclusion: Use Stablecoins Where They Are Truly Irreplaceable
The high cost of cross-border remittances is, at its core, institutional financial exclusion rather than a problem of technical efficiency. Stablecoins are not a cure-all: on fully competitive corridors like US→India, specialist digital remittance providers already achieve 2–3%, and stablecoins are not necessarily cheaper; BIS data also reminds us that, once on/off-ramp costs are added, stablecoins can actually run as high as 9% on some corridors.
But in orphaned corridors where correspondent banks have withdrawn and traditional channels cost over 10%, stablecoins provide "zero-to-one" access. That is where their value is truly irreplaceable. The more reasonable narrative is not that "stablecoins make remittances free," but that they connect forgotten corners to the global clearing network for the first time.
FAQ
Q1: What is the cost of global cross-border remittances in 2026? A: According to World Bank data, in Q1 2026 the global average cost of sending $200 was about 6.0%, around 8% in Sub-Saharan Africa, and about 13.4% through bank channels.
Q2: What are "orphaned corridors"? A: They are cross-border payment corridors that, due to the retreat of correspondent banks and a lack of alternative channels, fall into high-cost, multi-hop bottlenecks. They are common in low-income countries and small economies.
Q3: Can stablecoins really lower cross-border remittance costs? A: It depends on the corridor. In corridors with severe financial exclusion they can deliver "zero-to-one" access; but the BIS notes that stablecoins offer no systematic cost advantage, and on some corridors the all-in cost including on/off-ramp fees can reach 9%.
Q4: Why is the cost advantage of stablecoins unstable? A: Because the bulk of the all-in remittance cost sits at the "edges," namely the FX spread, local cash-out, and compliance friction, rather than in the on-chain fee. Stablecoins mainly optimise the middle-leg transfer.
References
Note: This article is an industry analysis based on public sources and the cited report. It is not investment advice.
Start your safe cryptocurrency journey now
OSL | Secure Ramps. Trusted Rails !
More topics
More topics
Latest
Global Remittance Costs at 6%, Africa at 8%: Can Stablecoins Truly Reduce Costs? BIS Offers a Cautious Response
Explore if stablecoins can lower global remittance costs (currently 6%) and their role in solving financial exclusion in orphaned corridors.
Global Remittance Costs at 6%, Africa at 8%: Can Stablecoins Truly Reduce Costs? BIS Offers a Cautious Response
SWIFT Doesn't Actually Move Your Money: How Stablecoins Rebuild B2B Payments
Discover how stablecoins restructure B2B payments, reduce costs by 70%, and solve the $27T trapped liquidity issue in the SWIFT network.
SWIFT Doesn't Actually Move Your Money: How Stablecoins Rebuild B2B Payments
From Crypto Chips to Global Money Rails: How Stablecoins Grew Up
Explore the three stages of stablecoin evolution: from exchange trading chips and DeFi liquidity to becoming global compliant payment infrastructure.
From Crypto Chips to Global Money Rails: How Stablecoins Grew Up
The CFO's Three Problems: How Stablecoins Are Quietly Entering Corporate Treasury
Discover how stablecoins address trapped cash, FX risk, and visibility gaps in corporate treasury through quiet pilots and institutional adoption.
The CFO's Three Problems: How Stablecoins Are Quietly Entering Corporate Treasury
Why is Bitcoin Frequently Mentioned Near the "200-Week Moving Average"? Understanding This Long-Term Indicator
Discover the significance of Bitcoin's 200-week SMA, historical returns, and how to use technical indicators for long-term crypto investing.
Why is Bitcoin Frequently Mentioned Near the "200-Week Moving Average"? Understanding This Long-Term Indicator
Is This Panic Selling Only Half as Intense as Before? Analyzing Bitcoin Market Structure via On-chain Data
Analyze Bitcoin market structure using on-chain data. Learn why the recent sell-off's realized loss is half of the previous round.
Is This Panic Selling Only Half as Intense as Before? Analyzing Bitcoin Market Structure via On-chain Data
Recommended for you
More topics
More topics
