From $135 to $225 and Back in a Week: Is SPCX a Classic Case of "Low Float, High FDV"?
The price path tells the story better than any definition. SpaceX priced its IPO at $135 a share on June 11, 2026, and opened on the Nasdaq the next day under the ticker SPCX at $150. It closed that first session at $160.95, up 19.3%, after touching $176.52 intraday — a roughly $2.1 trillion company on day one, in the largest IPO ever recorded.
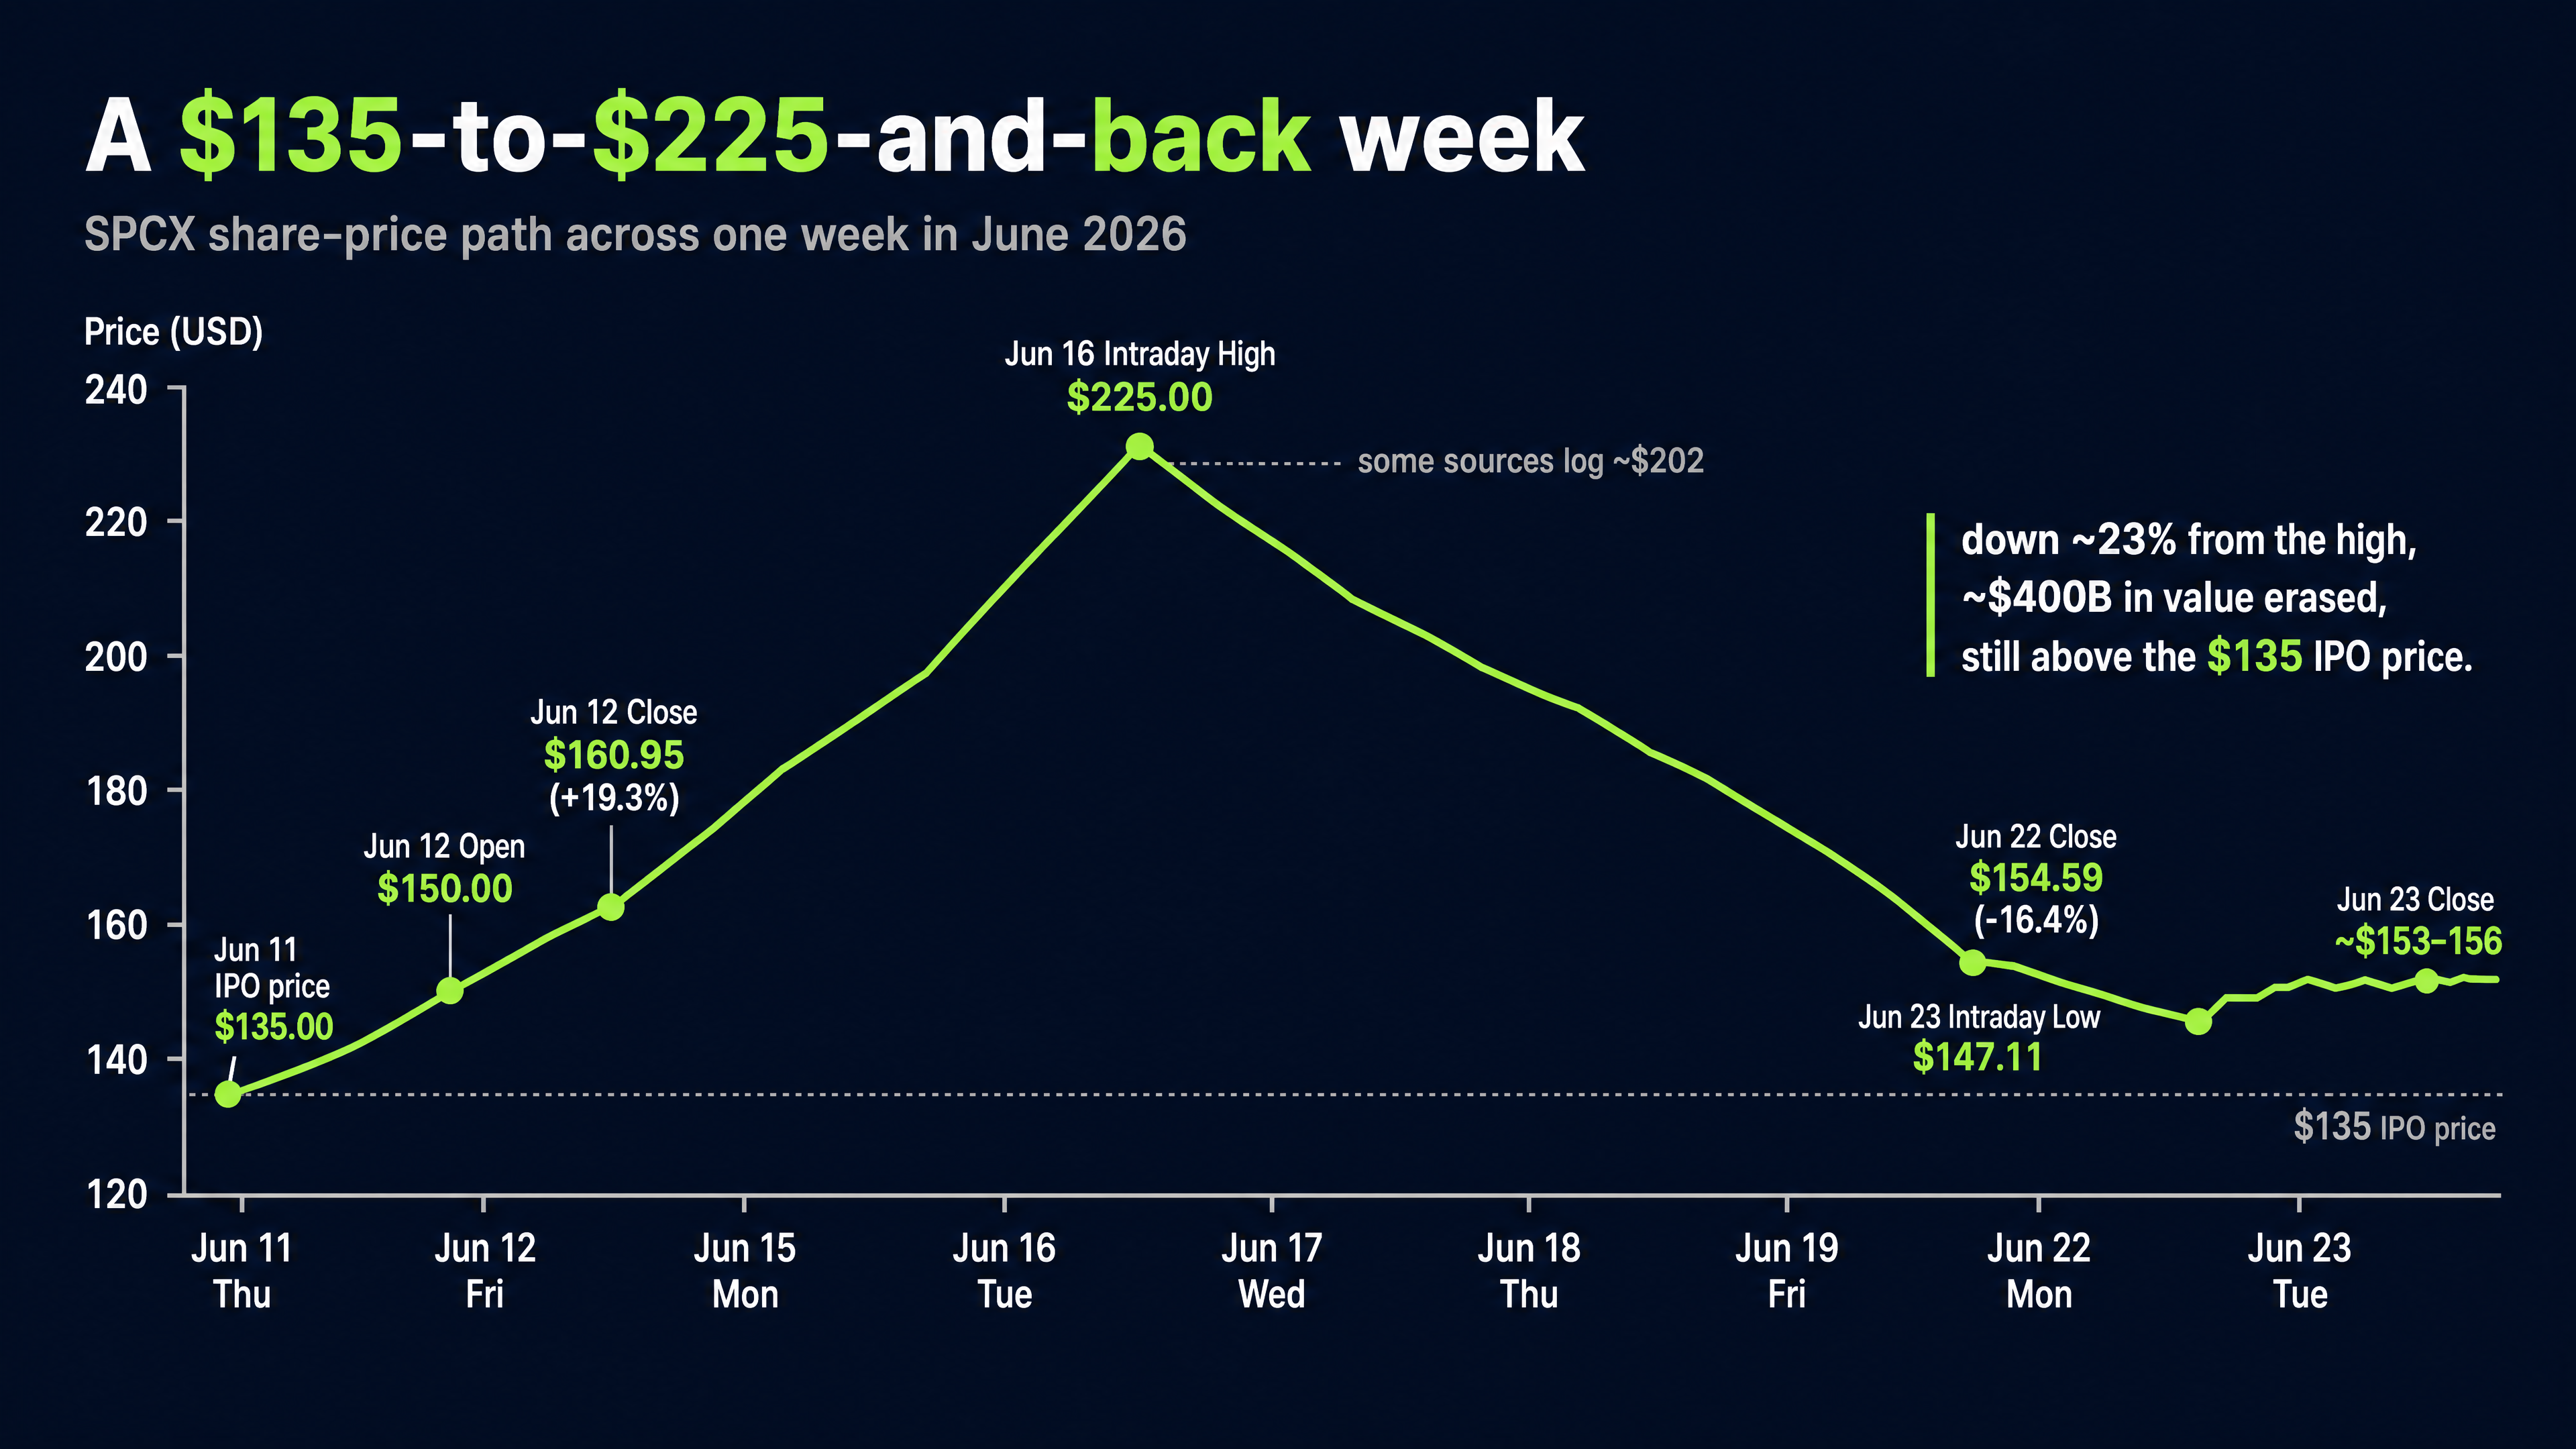
The rally extended. By June 16, SPCX had reached an intraday high of around $225 (some data providers log the peak nearer $202 — a discrepancy worth flagging rather than smoothing over). Either way, it was a 50%-plus gain over the offer price in a handful of sessions.
Then it reversed, fast. A string of down sessions culminated in a 16.4% single-day drop on June 22 — the largest since listing — closing near $154.59. The next day the stock briefly traded as low as $147.11, dipping under its own $150 opening print before steadying around $153–156. Roughly a week after the debut, SPCX had completed a full round-trip — down about 23% from the high, with something like $400 billion in market value erased, though still comfortably above the $135 IPO price.
The key analytical point: most of that volatility was not really a verdict on SpaceX the business. SpaceX is a genuinely scarce, high-quality asset, and a trillion-plus valuation is a defensible view. What the week exposed was a structure — one that deserves attention regardless of one's stance on the company.
The two numbers behind the move
Every traded asset has two "sizes," and the gap between them is where much of the SPCX drama lived.
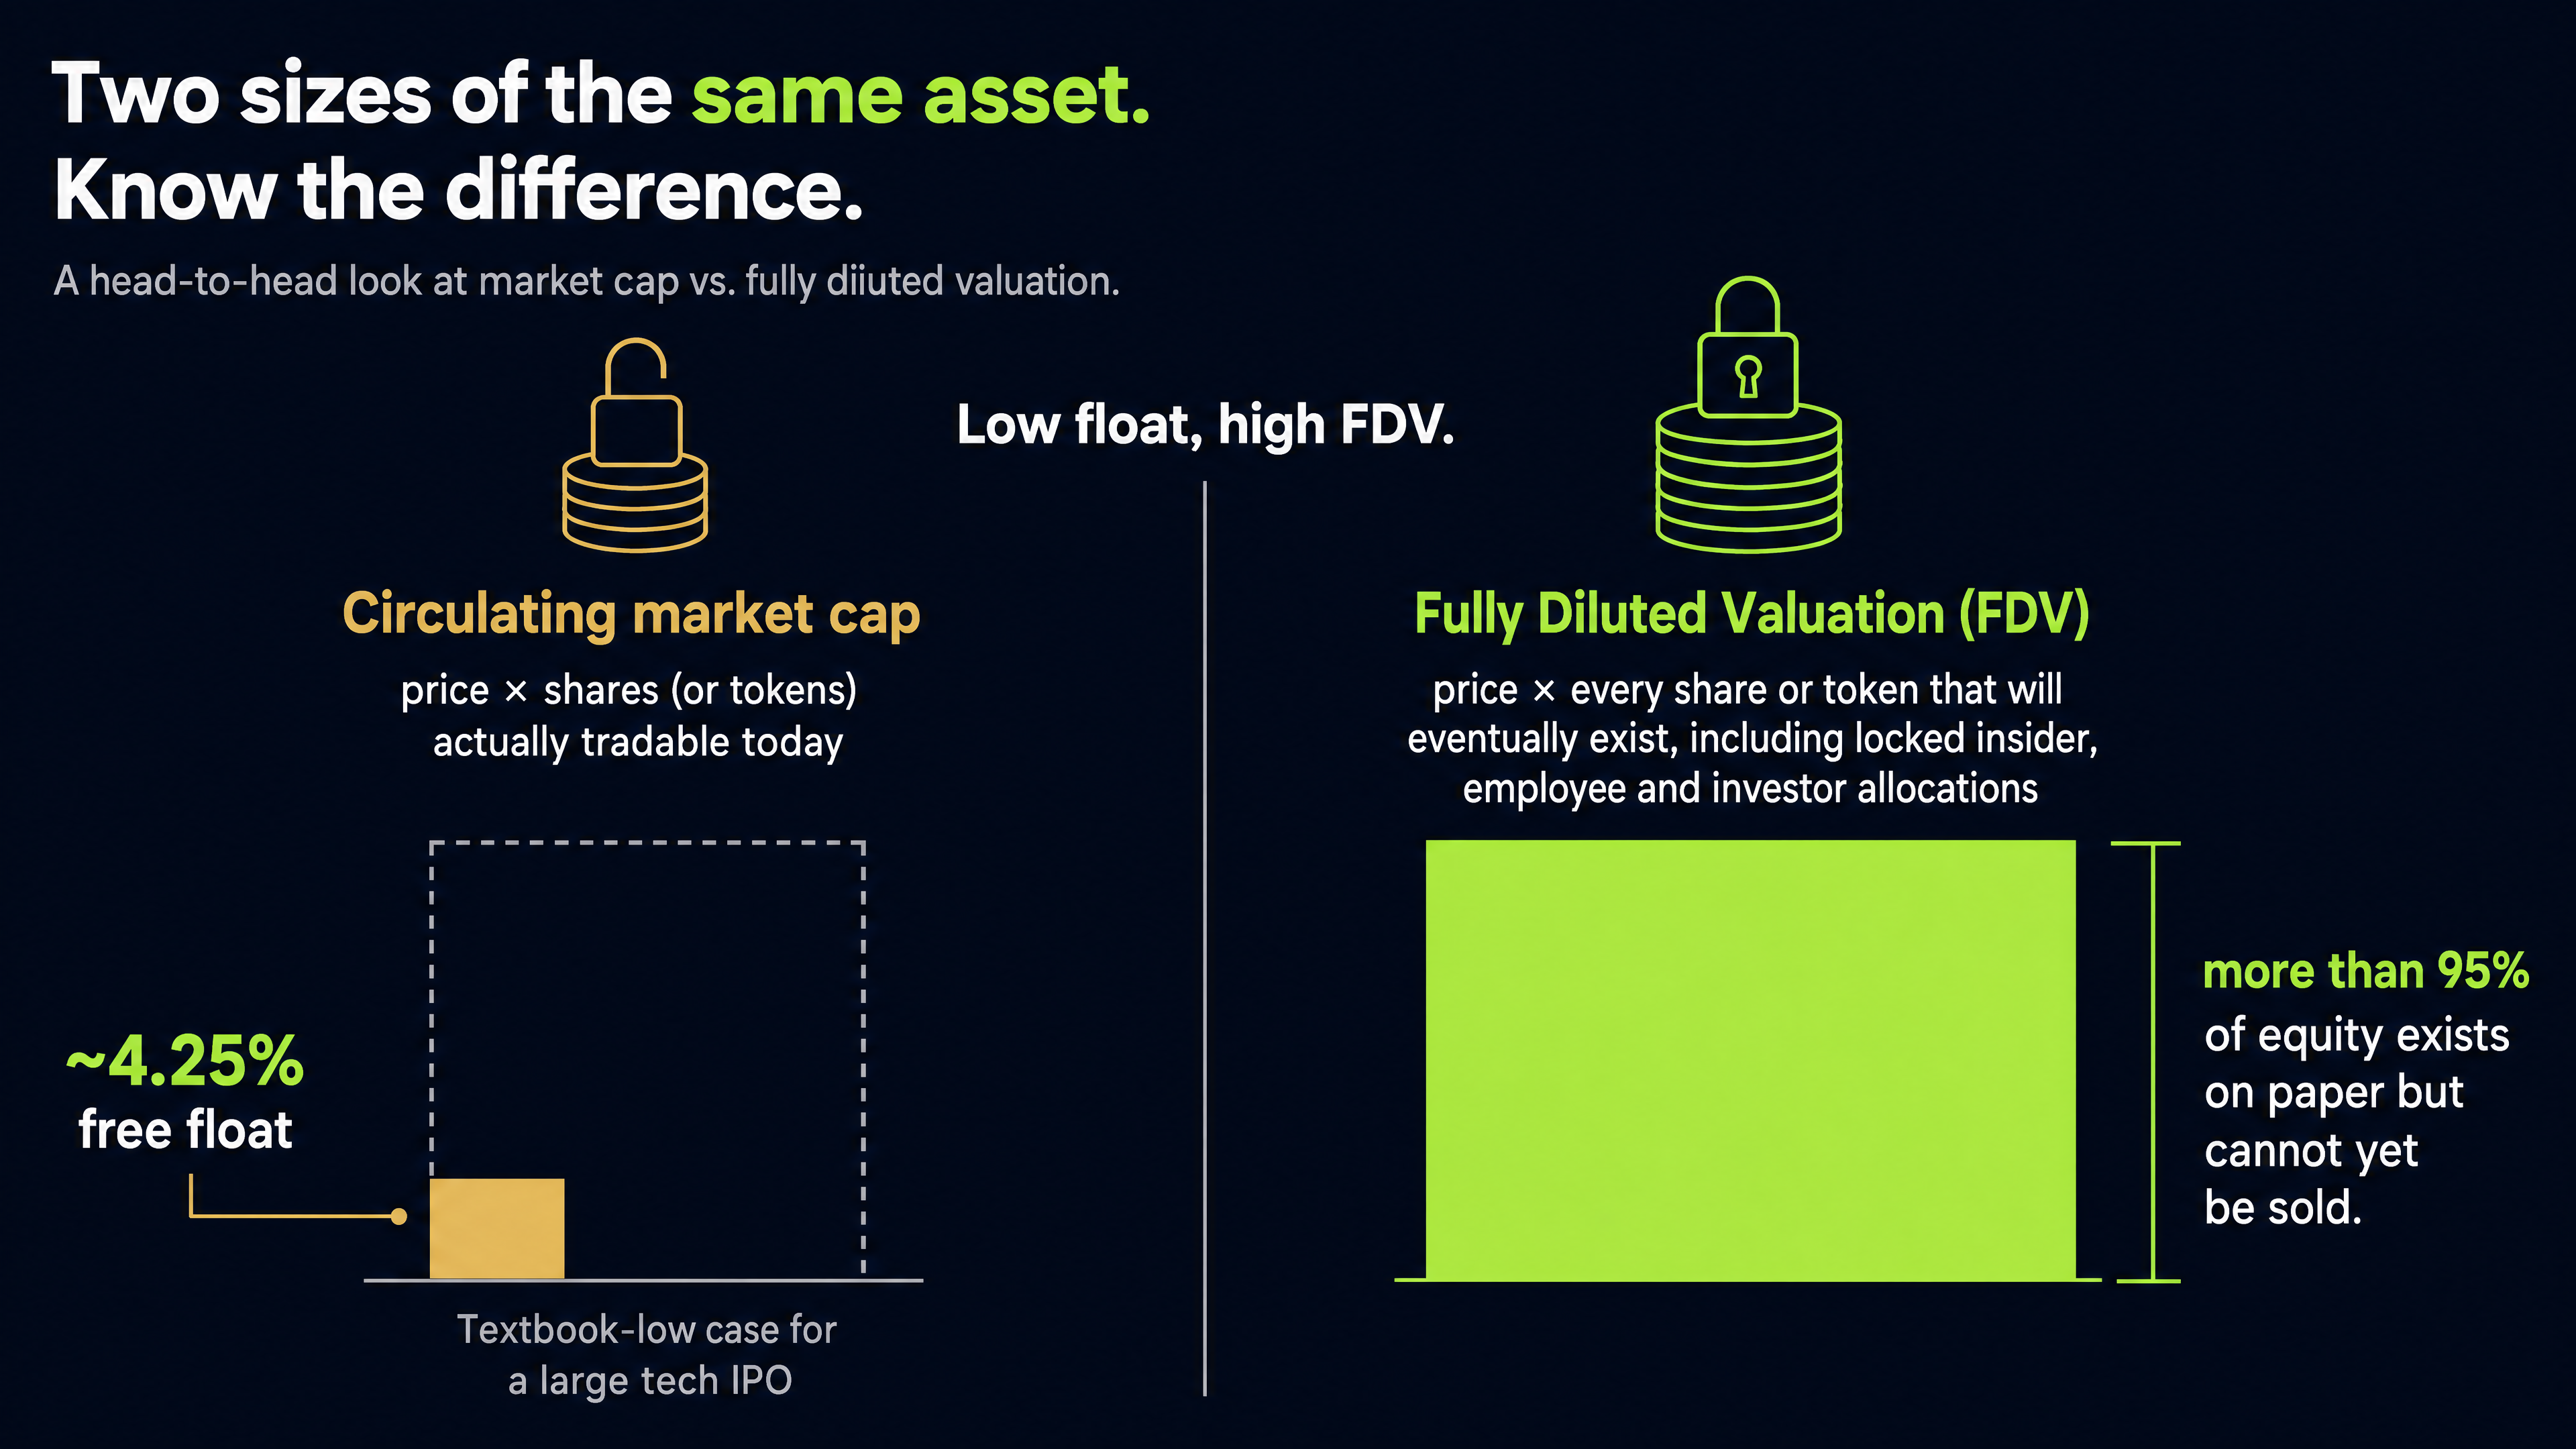
Circulating market cap= price × the shares (or tokens)actually tradable today.
Fully Diluted Valuation (FDV)= price ×every share or token that will eventually exist, including locked insider, employee, and investor allocations not yet released.
When only a thin slice is tradable but the FDV is enormous, the result is a low float, high FDV setup. SPCX is close to a textbook case: its initial free float was only about 4.25% of total shares — among the lowest ever for a large tech IPO. More than 95% of the equity existed on paper but could not yet be sold.
"Low float, high FDV" is best read as a description, not an accusation. But it is a description that predicts behavior — and SPCX behaved accordingly.
Why a thin float moves like that
When very few shares are available against strong demand, two things tend to follow — and both appeared here:
On the way up, price moves more than fundamentals alone would justify.
A modest amount of buying chases a tiny tradable supply, so the quote can run well past the offer price quickly. That is the "this can only go up" impression a thin float manufactures — and it is how SPCX reached ~$225.
The pressure valve arrives later.
Once options began trading, bears finally had a practical way to express a downside view, and the float itself is scheduled to expand sharply — from about 4% toward roughly 37%–44% by late August/September as lockups expire. More supply meeting the same demand is the classic backdrop for the kind of air-pocket SPCX hit on June 22.
Seen this way, the round-trip is not mysterious. A small float amplified the rally; the first genuinely two-way liquidity (options) plus a looming supply unlock amplified the pullback. One added wrinkle: with so few shares trading, a cluster of leveraged SPCX ETFs reportedly had to rebalance into the same thin market, magnifying the swings in both directions.
The next test: the unlock window
This is where the analysis turns forward-looking — and where it should stay carefully hedged. A reasonable hypothesis, not a prediction, is that the lockup expirations could bring a fresh wave of supply, and with it the potential for renewed selling pressure. Whether that pressure actually materializes depends on demand, sentiment, and how much is already priced in by the time each date arrives.
What's known is the schedule itself. Per multiple outlets, SpaceX opted for a staggered, tiered unlock rather than a single 180-day cliff:
A first tranche of roughly 20% of eligible shares opens up around the second-quarter earnings report in late July/early August.
An additional ~10% can unlock automatically if the stock trades ~30% above the $135 IPO price (i.e., above ~$175).
Two further tranches of about 7% each are expected around August 21 and September 10.
Cumulatively, insiders could be free to sell up to roughly 44% of shares by early September, while Elon Musk's own stake is locked for 366 days.
As ainvest framed it, the staggered design avoids a single "supply cliff" but may instead create sustained pressure spread over several weeks — which the same analysis stressed is "not a buying signal" either. In other words, the structure could cut both ways: no single dramatic dump, but a longer stretch during which new supply meets the market. This is a scenario to monitor, not a foregone conclusion.
How analysts are framing it
Professional views on SPCX are notably split, which is itself informative — it underscores that the debate is about valuation and structure, not whether SpaceX is a serious company. (All figures below are third-party model estimates, not facts, and ratings can change.)
Morningstar initiated coverage with a Sell rating and a fair value estimate around $62–63 a share (narrow economic moat), with even its most optimistic "moonshot" scenario reaching only about $154— well below where the stock traded for much of its first week. Morningstar has repeatedly flagged the "Musk premium" and post-lockup selling pressure.
22V Research's Jeff Jacobson has discussed positioning around the September 18 options expiration
— for example, a covered-call-style trade selling $200 calls — a stance that treats ~$200 as a level worth fading rather than chasing. (Reported as one desk's strategy, not advice.)
More broadly, several desks have made the same structural point that drives this article: with only ~4% of shares freely trading and lockups lifting from August, the float — not the fundamentals — is doing much of the short-term workin the price.
The throughline across these views isn't "SpaceX is bad." It's that a thin float and a known unlock calendar make the near-term path unusually supply-driven.
The crypto crossover — why digital-asset readers should care
This was not only a stock story. Tokenized versions of the shares (such as SPCXx) launched on public blockchains, and pre-IPO perpetual futures on SPCX traded over $1.3 billion in volume before a single real share changed hands. Several crypto platforms even took pre-IPO orders, then refunded users after failing to secure the underlying shares.
The takeaway: tokenization can wrap any exposure — including a low-float, high-FDV one — in a few clicks. The wrapper is a convenience; it does not change the underlying supply mechanics, and it can add its own layers (custody of the real asset, price gaps between venues) that need to be understood. For anyone active in tokens, this exact "small float now, big supply later" pattern shows up far more often than in equities — which is precisely what makes SPCX such a useful teaching case.
This pattern is everywhere in crypto
SPCX gave the structure a trillion-dollar stage, but in digital assets it has been the dominant launch template for years. Through 2024, a wave of new tokens debuted with very low circulating supply against very high FDV; by one industry tally, scheduled token unlocks for that year totaled roughly $82 billion, and the average circulating-to-FDV ratio for new listings was still only around 35%. Most newly listed tokens on major exchanges underperformed after listing as that supply hit the market.
A few widely cited examples (data points are historical snapshots and change constantly — always check current figures):
Token | What made it "low float, high FDV" |
|---|---|
Worldcoin (WLD) | CoinGecko flagged it as among the lowest-float large caps, with a market-cap-to-FDV ratio near 0.02 — i.e., only ~2% of fully diluted value circulating at the time. |
Starknet (STRK) | Low initial float with large scheduled unlocks; cited repeatedly in 2024 post-mortems on FDV "air" deflating as tokens released. |
Saga (SAGA) | One of the lowest-float 2024 launches (MC/FDV ~0.09 per CoinGecko's snapshot). |
Cheelee (CHEEL) | Among CoinGecko's lowest-float large caps (~0.06). |
Wormhole (W), Dymension (DYM), Xai (XAI) | Frequently named in 2024 reviews where rapid post-TGE unlocks coincided with steep FDV/price declines. |
The point isn't to single out any project — it's that the shape repeats. A small tradable supply meets enthusiastic demand at launch, the headline FDV looks enormous, and the multi-year unlock schedule then defines much of the price action that follows. As one Binance Research piece put it, this model came to set "the tone for the industry's trajectory" — and, notably, fairer-launch alternatives (a larger initial float, fewer locked insider tokens) have since been held up as the contrast.
Reading a setup like this — a checklist, not a signal
A framework for understanding risk, not a recommendation to buy or sell anything.
Find the float ratio.Tradable supply ÷ total supply. A very low ratio (say, under ~20%) is a caution flag, not a green light.
Read the unlock / lockup calendar.When does supply release, how much, and to whom? Concentrated unlocks tend to bring concentrated selling.
Compare FDV to circulating cap.A large multiple means a large dilution overhang sitting above today's price.
Check holder concentration.How much sits with insiders, VCs, or a few wallets?
Respect the calendar over the chart.In these structures, the supply timeline usually matters more than any indicator, and the most honest price discovery tends to come after the early hype fades and float normalizes.
The bottom line
To be clear, "low float, high FDV" is not a verdict that something is a scam, and it is not a bear case on SpaceX. It is a risk structure — a small tradable supply that can prop a price up, sitting above a large future supply that will eventually reach the market. SPCX simply put that structure on the biggest stage in market history, and a single week displayed both sides of it: the melt-up and the round-trip.
The discipline that follows applies equally to a $1.75-trillion rocket company and a brand-new token: separate what's tradable now from what's coming, and never let a thin float turn a high valuation into the illusion of a low one.
This article compiles publicly reported information for educational purposes only. It does not constitute investment advice and gives no price targets. Figures cited (including peak prices) vary slightly by data source and are noted where they differ. OSL does not offer SPCX-related products. Markets are volatile; assess your own risk tolerance.
Start your safe cryptocurrency journey now
OSL | Secure Ramps. Trusted Rails !
More topics
More topics
Latest
From $135 to $225 and Back in a Week: Is SPCX a Classic Case of "Low Float, High FDV"?
Analyze SPCX stock's 50% surge and reversal. Learn why its low float, high FDV structure mirrors crypto tokens and what future unlocks mean for price.
From $135 to $225 and Back in a Week: Is SPCX a Classic Case of "Low Float, High FDV"?
Global Remittance Costs at 6%, Africa at 8%: Can Stablecoins Truly Reduce Costs? BIS Offers a Cautious Response
Explore if stablecoins can lower global remittance costs (currently 6%) and their role in solving financial exclusion in orphaned corridors.
Global Remittance Costs at 6%, Africa at 8%: Can Stablecoins Truly Reduce Costs? BIS Offers a Cautious Response
SWIFT Doesn't Actually Move Your Money: How Stablecoins Rebuild B2B Payments
Discover how stablecoins restructure B2B payments, reduce costs by 70%, and solve the $27T trapped liquidity issue in the SWIFT network.
SWIFT Doesn't Actually Move Your Money: How Stablecoins Rebuild B2B Payments
From Crypto Chips to Global Money Rails: How Stablecoins Grew Up
Explore the three stages of stablecoin evolution: from exchange trading chips and DeFi liquidity to becoming global compliant payment infrastructure.
From Crypto Chips to Global Money Rails: How Stablecoins Grew Up
The CFO's Three Problems: How Stablecoins Are Quietly Entering Corporate Treasury
Discover how stablecoins address trapped cash, FX risk, and visibility gaps in corporate treasury through quiet pilots and institutional adoption.
The CFO's Three Problems: How Stablecoins Are Quietly Entering Corporate Treasury
Why is Bitcoin Frequently Mentioned Near the "200-Week Moving Average"? Understanding This Long-Term Indicator
Discover the significance of Bitcoin's 200-week SMA, historical returns, and how to use technical indicators for long-term crypto investing.
Why is Bitcoin Frequently Mentioned Near the "200-Week Moving Average"? Understanding This Long-Term Indicator
Recommended for you
More topics
More topics
