Bitcoin Falls Below Global M2 Liquidity Fair Value: Analysts Cite "Unprecedented Mispricing" as Catalyst for Strong Rebound
According to a May 27 report by Cointelegraph, several crypto market analysts have pointed out that Bitcoin's (BTC) current price is experiencing an "unprecedented" negative deviation relative to the global M2 money supply. If historical correlations hold true, BTC could face a round of "aggressive repricing."
BTC/Gold Ratio Drops Two Standard Deviations Below Liquidity Fair Value
Crypto trader RobynHD posted on the social platform X that Bitcoin is currently trading "well below its global liquidity fair value," a phenomenon that has rarely persisted historically.
A chart provided by Andre Dragosch, Head of Research for Europe at Bitwise, shows that the ratio of BTC to gold (BTC/XAU) has deviated extremely from its fair value derived from global M2—with a Z-score approaching -2, meaning the price sits two standard deviations below the fair value line.
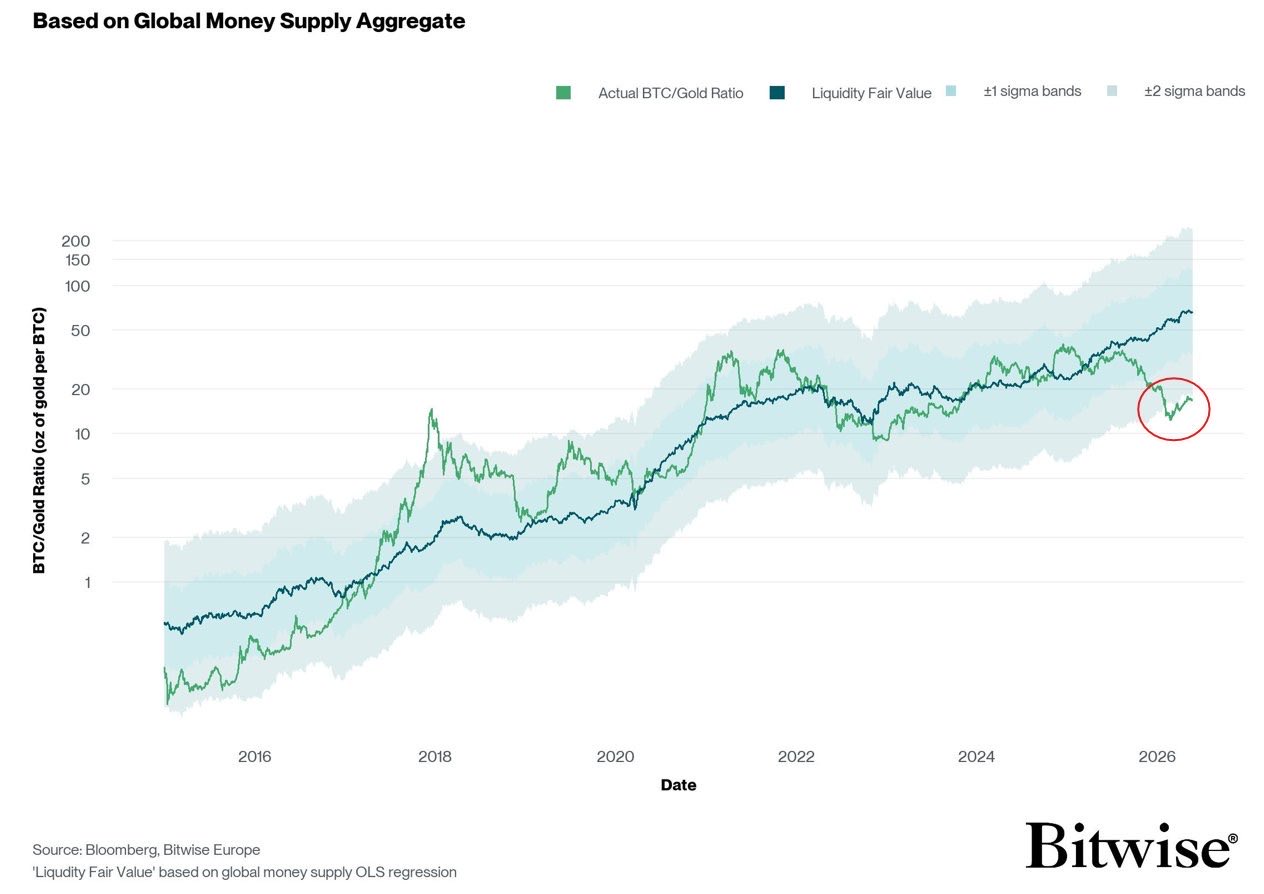
RobynHD stated: "If the relationship between BTC and liquidity remains intact, then BTC is currently completely mispriced. A Z-score approaching -2 has never occurred historically, pointing to an extreme point of maximum mispricing."
Bullish Logic: Mean Reversion + Record High M2
Core arguments supporting this view include:
Global M2 at Historic Highs: The money supply of major central banks continues to expand, creating a liquidity environment that is theoretically favorable for risk assets.
Historical Positive Correlation: Bitcoin typically performs best during periods of sustained M2 growth, although the cycles of the two are not perfectly synchronized.
Extreme Deviations Often Signal Reversals: In the past, significant drops in BTC price below its liquidity fair value have consistently been followed by strong catch-up rallies.
Meanwhile, the crypto market has recently decoupled from US equities—while US stocks have continually hit new highs this month, BTC remains range-bound. Analysts believe this divergence inherently suggests there is room for crypto assets to "catch up."
Dissenting Voices: M2 Model Has Design Flaws
Not everyone agrees with this framework. Julio Moreno, Head of Research at CryptoQuant, bluntly stated that the model "is flawed by design":
Data Frequency Issues: M2 does not have daily data; most analyses rely on monthly or weekly interpolation.
Overweighting of China: China accounts for an extremely high proportion of the global M2 series, and since China's M2 increases almost monotonically, it weakens the signaling value of the indicator.
The trading account Cryptic Trades raised doubts from a historical timing perspective: During the 2022 bear market, M2 only peaked after Bitcoin hit its true bottom of around $18,000. If investors had waited for M2 to peak before selling, they would have essentially sold at the absolute bottom.
Analyst Rekt Capital also previously noted that after the Bitcoin bull market peaked in November 2021, global M2 continued to rise for another 5 months before peaking in April 2022—indicating that the BTC price cycle can lead the liquidity cycle.
Key Takeaways
Bullish Views | Skeptical Views |
|---|---|
BTC/M2 deviation reaches historic extremes; high probability of mean reversion. | M2 model is flawed by design with high data noise (e.g., China data). |
Global liquidity hits record highs; strong catch-up potential for risk assets. | BTC's 4-year cycle pattern may hold more explanatory power than M2 correlation. |
Z-score hits -2, implying extreme mispricing. | Historical data shows M2 inflection points often lag behind BTC prices. |
The current market is in a phase of intensified divergence between bulls and bears. The M2 liquidity framework offers a bullish macroeconomic narrative, but investors should be aware of the model's limitations and make comprehensive judgments by integrating multi-dimensional indicators such as on-chain data and derivatives structures.
Start your safe cryptocurrency journey now
OSL | Secure Ramps. Trusted Rails !
More About Topics
More About Topics
Latest
60-Vote Hurdle for CLARITY Act Exposes Limits of Legislative Hope
The CLARITY Act's September 15 procedural vote exposes why implemented regulatory frameworks may offer institutions more operational certainty than pending U.S. legislation.
60-Vote Hurdle for CLARITY Act Exposes Limits of Legislative Hope
XRP Rebounds 30% Then Slips: DeFi Infrastructure Faces Volatility Exam
XRP Ledger's $1.1 billion stablecoin expansion and new lending protocol foundation face an immediate stress test as XRP price swings 30% monthly.
XRP Rebounds 30% Then Slips: DeFi Infrastructure Faces Volatility Exam
$0.325 SKY Forecast: Valuation Model or Institutional Wish?
Standard Chartered's $0.325 price target on Sky's governance token applies bank-style valuation to on-chain credit infrastructure, but the forecast depends on USDS adoption and borrowing expansion that remains nascent.
$0.325 SKY Forecast: Valuation Model or Institutional Wish?
SEC Custody Rewrite Hits White House, Jurisdictional Gap Widens
The SEC's proposed crypto custody rewrite entered White House review on August 25, 2026, leaving U.S. institutional frameworks unresolved while banks and custodians position services under divergent national rule stacks.
SEC Custody Rewrite Hits White House, Jurisdictional Gap Widens
India's $100M Bond Tokenization: A Rights Structure Stress Test
SEBI's Demat 2.0 pilot issued over $100 million in tokenized bonds using digital rupee settlement, but its phased rollout from institutional pilots to secondary trading and retail access tests whether off-chain...
India's $100M Bond Tokenization: A Rights Structure Stress Test
Recommended For You
More About Topics
More About Topics