POL Price Prediction 2026–2030–2040: Polygon (ex-MATIC) Outlook

Key Takeaways: POL Price Predictions at a Glance
POL = Polygon Ecosystem Token (ex-MATIC) after Polygon’s MATIC→POL migration (1:1) tied to Polygon 2.0.
Third-party forecasts for 2030 vary sharply: some models sit around ~$0.14, while others project ~$0.31–$0.46—a wide gap driven by assumptions about Polygon’s adoption and value capture.
2040 numbers are highly speculative: some calculators cluster around ~$0.23–$0.25, while other publications point to multi-dollar scenarios. Treat all long-horizon figures as illustrative, not actionable targets.
Tokenomics matter: POL’s whitepaper describes 10B initial supply for migration plus deterministic emissions (1% validator rewards + 1% community treasury), with constraints on increasing beyond those caps.
This article summarizes third-party projections and public info; it is not investment advice.
POL All-Time Price Performance
POL is the successor token to MATIC, and price history can appear under different tickers or venues depending on the data provider. For current market reference, CoinMarketCap and TradingView provide POL-specific pricing pages (useful for verifying the polygon price prediction you embed in your CMS).
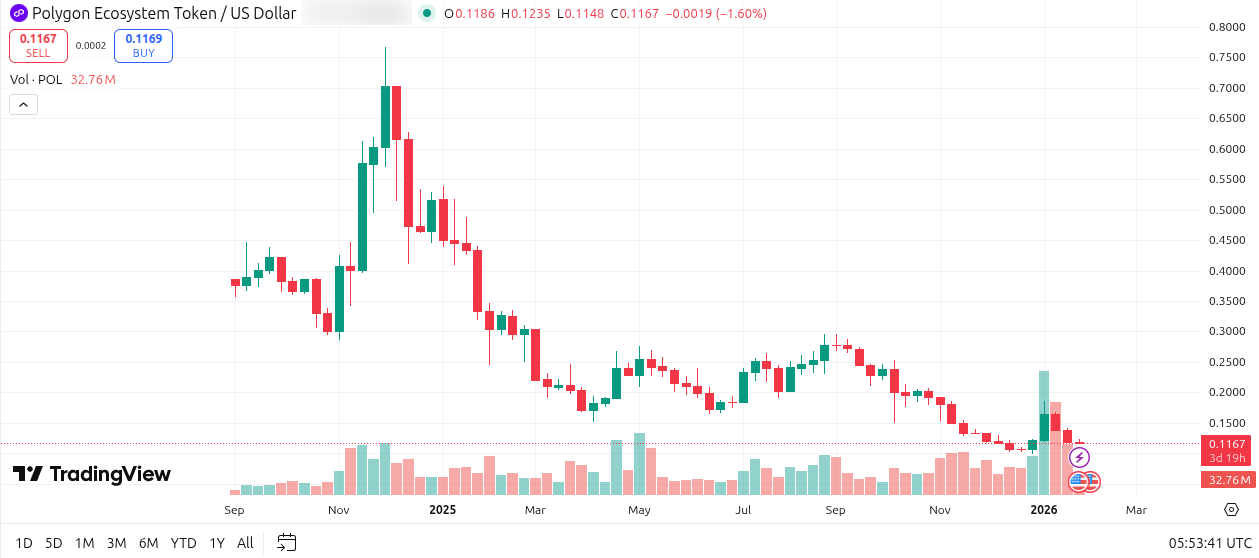
Source: TradingView chart
Important note: legacy “MATIC” charts may still be referenced by some sites, so always confirm whether a chart is showing MATIC, POL, or a synthetic conversion feed. Polygon’s official migration notes can help clarify that context.
Current Market Overview (as of 2026)
By early 2026, POL has established presence across major trading platforms and continues to gain traction within the Ethereum Layer-2 space. Key market characteristics include:
Volatility Profile: POL exhibits the volatility typical of early-stage protocol tokens, particularly during upgrade cycles and major announcements.
Liquidity Trends: Liquidity is concentrated around centralized exchanges, with increasing interest in POL-based DeFi pools and staking derivatives.
Ecosystem Integration: POL is gradually replacing MATIC as the default staking and fee token across Polygon PoS, zkEVM, and Supernets.
While adoption is growing, uncertainty remains around full migration timelines, validator participation, and whether POL can maintain narrative momentum amid competition from other L2 tokens.
Tokenomics and Supply Mechanics
Understanding POL’s long-term valuation requires a clear view of tokenomics, supply availability, emissions, and current price trends in the crypto market. Because POL is still in a migration phase (from MATIC) and some parameters may evolve over time, the most useful approach is to separate what is known today from what depends on future disclosures.
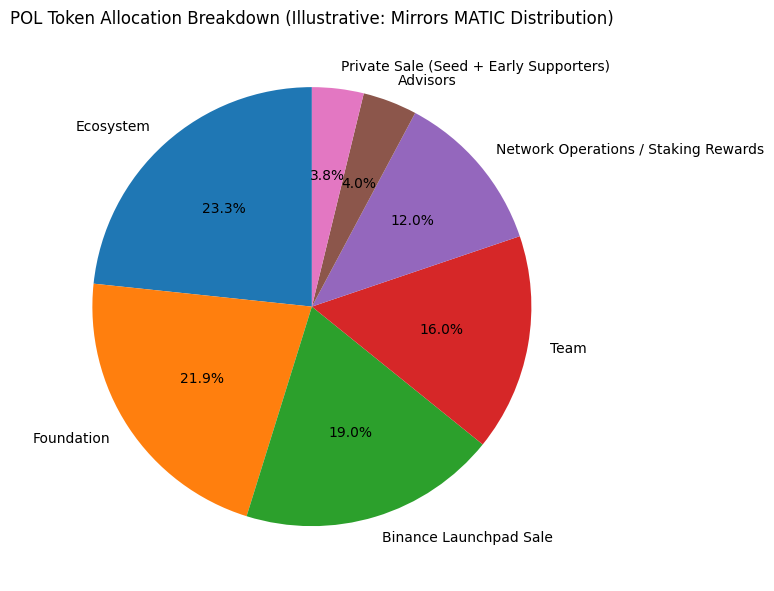
To ground the discussion, the table and pie chart below summarize POL’s initial allocation structure using the best available proxy: Polygon’s stated intent that POL’s distribution mirrors MATIC’s original distribution (with POL’s initial supply set to match MATIC 1:1).
Allocation | % of supply | Tokens (of 10B) |
|---|---|---|
Ecosystem | 23.33% | 2,333,000,000 |
Foundation | 21.86% | 2,186,000,000 |
Binance Launchpad Sale | 19.00% | 1,900,000,000 |
Team | 16.00% | 1,600,000,000 |
Network Operations / Staking Rewards | 12.00% | 1,200,000,000 |
Advisors | 4.00% | 400,000,000 |
Private Sale (Seed + Early Supporters) | 3.80% | 380,000,000 |
With that context in place, several supply mechanics are particularly relevant for a 2026–2040 outlook:
Total Supply and Emissions: POL is designed to support validator incentives over the long term. That implies ongoing emissions for network security, but the impact on valuation depends on how emissions are balanced against ecosystem demand.
Initial Circulating Supply: Circulating POL supply is shaped by how quickly MATIC holders migrate and how much POL is actively staked or held. Any unconverted MATIC effectively delays full POL supply normalization.
Staking Incentives and Distribution: Validators securing one or more Polygon chains earn rewards in POL. This can strengthen participation and security, but it also introduces a pathway for additional tokens to enter circulation over time.
Governance and Treasury Allocation: A portion of POL is reserved for governance-linked functions such as treasury grants, ecosystem incentives, and long-term development—factors that influence both distribution and sell/hold dynamics.
If Polygon publishes a formal unlock schedule and/or a detailed emissions chart for POL, it would significantly improve the precision of long-range valuation frameworks. Until then, any serious analysis should explicitly account for supply uncertainty can significantly impact the price of POL in the coming years, particularly around migration timing, staking participation, and emissions policy.
Market Capitalization and Valuation Metrics
Price predictions often overlook the link between a token’s market cap and its circulating supply. For POL, this relationship provides a grounded lens for evaluating whether a specific future price is structurally feasible.
The table below illustrates how different combinations of POL price levels and circulating supply affect implied market capitalization:
Implied Market Cap at Various POL Prices and Supplies
Circulating Supply | $0.5 | $1.00 | $2.00 | $5.00 | $10.00 |
|---|---|---|---|---|---|
1 Billion | $0.50B | $1.00B | $2.00B | $5.00B | $10.00B |
2 Billion | $1.00B | $2.00B | $4.00B | $10.00B | $20.00B |
5 Billion | $2.50B | $5.00B | $10.00B | $25.00B | $50.00B |
10 Billion | $5.00B | $10.00B | $20.00B | $50.00B | $100.00B |
This table is illustrative and does not represent a forecast. It’s designed to contextualize the range of possible valuations under different scenarios of adoption and token availability.
In practical terms:
A $5 POL token with 10B circulating supply implies a $50B market cap — comparable to Ethereum’s Layer-1 cap in early 2024.
A $1 POL price at 2B supply aligns more modestly with emerging Layer-2s.
By comparing market cap ranges rather than just token price, we can assess how realistic a target might be, considering the broader crypto asset landscape.
Scenario Definition + Forecast Summary Table
This POL price prediction 2026–2030–2040 overview compiles third-party sources. OSL does not set price targets here. Forecasts vary because they use different inputs: technical indicators, fixed-growth calculators, macro assumptions, and adoption narratives.
Methods commonly used by prediction pages
Fixed-growth calculators (user-chosen annual rate; output changes if the input changes) e.g Kraken
Algorithmic/quant forecasts (historical price + volatility + cycle assumptions) e.g. CoinCodex
Narrative projections (assume Polygon’s L2/ZK roadmap succeeds, ecosystem usage expands, etc.) e.g. AMBCrypto
Forecast summary table
Year | Source | Low | High | Approach |
|---|---|---|---|---|
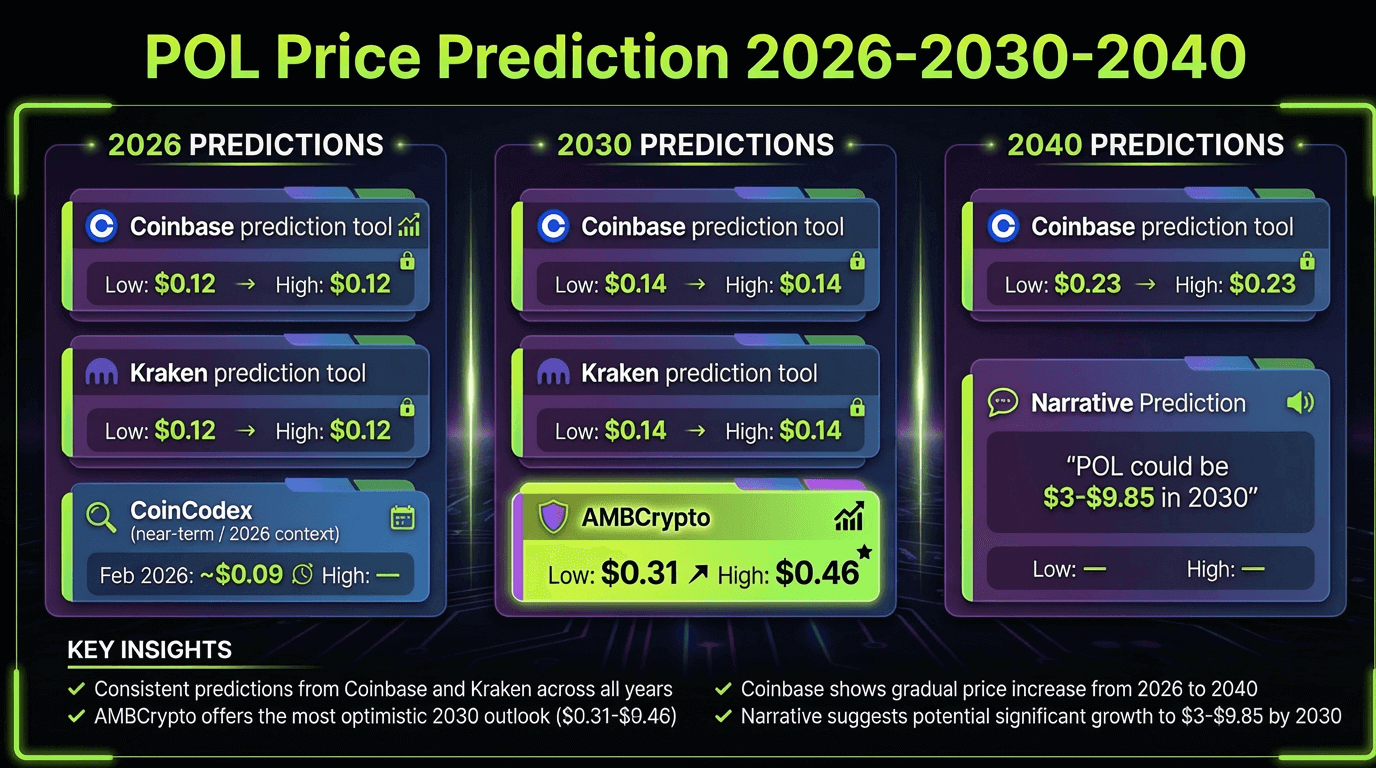
2026 | Coinbase prediction tool | ~0.12 | ~0.12 | Calculator-style projection path. |
2026 | Kraken prediction tool | ~0.12 | ~0.12 | Similar calculator approach (assumes steady growth). |
2026 | CoinCodex (near-term / 2026 context) | ~0.09 (Feb 2026) | — | Short-horizon forecast; not a full-year band. |
2030 | Coinbase prediction tool | ~0.14 | ~0.14 | Conservative calculator path. |
2030 | Kraken prediction tool | ~0.14 | ~0.14 | Similar mid-$0.10s baseline. |
2030 | AMBCrypto | ~0.31 | ~0.46 | Higher band reflecting stronger adoption scenario. |
2040 | Coinbase prediction tool | ~0.23 | ~0.23 | Long-range calculator output. |
2040 | “POL could be $3–$9.85 in 2030” (narrative) | — | — | Example of far more optimistic narrative-based outlook (shows dispersion). |
How to interpret dispersion: the large spread is less about “who is right” and more about market sentiment regarding the price of POL, which assumptions you believe are plausible (network usage growth, fee capture, regulatory clarity, and competition).
POL Price Outlook for 2026
Because 2026 is closer than 2030/2040, many forecasts stay anchored near today’s base price level and recent volatility.
Bear scenario (low-$0.08 to ~$0.12)
Quant/near-term forecasting pages include low-$0.09 style outputs around early 2026 windows, suggesting downside risk if momentum remains weak.
What could align with this scenario
Risk-off macro conditions, lower altcoin liquidity, or weaker on-chain activity
Slower uptake of Polygon’s broader Polygon 2.0 / AggLayer vision in measurable usage
Base scenario (~$0.12–$0.15)
Calculator models (Coinbase/Kraken) cluster near ~$0.12 in 2026 and creep upward gradually.
What could align with this scenario
Steady network usage without a breakout cycle
Incremental improvements and continued ecosystem relevance, but not an “explosive” adoption curve
Bull scenario (higher if adoption surprises)
Some sources frame higher outcomes over time, but a responsible 2026 “bull” discussion should be conditional: it would likely require a stronger market cycle plus tangible adoption signals (more transactions, active addresses, and real ecosystem fee demand). CoinMarketCap’s updates also highlight how staking flows can affect sentiment, even when near-term price is choppy.
POL Price Outlook for 2030
2030 is where forecasts diverge the most, with some predictions leaning bearish.
Why 2030 projections split
Calculator tools essentially extrapolate a steady path to ~$0.14.
Other publications argue POL could trade materially higher (e.g., ~$0.31–$0.46), based on stronger adoption and ecosystem growth assumptions.
Scenario framing
Bear case (sub-$0.15): Polygon remains relevant but faces stronger competition; value capture stays limited (close to calculator baselines).
Base case (~$0.15–$0.30): moderate ecosystem expansion, improved interoperability narrative, and sustained usage. (This is a synthesis band; exact values differ by source.)
Bull case (~$0.31–$0.46+): aligns with higher-band forecasts that assume Polygon’s scaling roadmap drives durable demand.
POL Price Outlook for 2040
2040 forecasts should be treated as highly speculative.
Calculator-style tools extend to ~$0.23–$0.25 in 2040–2042.
Other long-form narratives publish much higher multi-dollar ranges, which implicitly assume decades of compounding adoption and sustained market leadership—assumptions that are very difficult to validate today.
The key issue for 2040 is not “what number,” but “what must be true”:
Polygon must keep shipping scalable infrastructure that developers choose
The ecosystem must retain meaningful fee demand and institutional relevance
Regulation must evolve in a way that supports broad tokenized value transfer
POL Metrics to Watch Checklist
If you want a disciplined way to track whether the market is drifting toward conservative or optimistic scenarios, focus on observable indicators:
1. Token migration and tokenomics clarity
Confirm POL’s role as the native token after migration and understand emissions described in the whitepaper.
2. Supply, emissions, and incentives
Whitepaper: 10B initial supply for migration; emissions aimed at validator rewards and community treasury with specific constraints.
Market trackers: circulating supply and market cap context (for sanity-checking valuation narratives).
3. Network usage
Active users, transaction demand, and fee generation matter more than headlines in the cryptocurrency market sentiment. Watch whether usage grows sustainably versus short bursts.
4. Interoperability and scaling adoption
Polygon’s broader “Polygon 2.0” direction and interoperability goals matter if they translate into real production usage (not just announcements).
5. Regulatory developments
For institutional participation, clarity on trading venue licensing, custody standards, and stablecoin/payment rules can reshape adoption curves (Hong Kong and other hubs included).
From POL Insights to Practical Access With OSL
Price predictions are inherently uncertain. For many participants—especially institutions—the more practical question is access and operational safety.
OSL is Asia’s leading stablecoin and digital‑asset trading and infrastructure provider, backed by up to US$1 billion in insurance coverage. At OSL, users can trade POL through institutional-grade market services, hold it in insured custody, and integrate it into broader, rules-based portfolios, subject to applicable regulations.
POL is available on OSL through Flash Trade, a simplified trading service that allows users to buy, sell or convert supported tokens with zero trading fees. All transactions are executed at a quoted price that can be reviewed before confirmation. You can access POL trading directly on our POL/USD Flash Trade page. Flash Trade is designed to complete transactions in just three steps:
Buy POL
Select POL and pay with USD.
Enter either the USD amount you want to spend or the amount of POL you want to buy.
Review the quote and confirm the trade.
FAQs on POL Price Predictions
Is POL the same as MATIC?
POL is the successor token to MATIC in the Polygon ecosystem. Polygon announced the MATIC→POL migration effective September 4, 2024, with 1:1 migration mechanics depending on where tokens were held.
Why do some sites still show “MATIC” predictions?
Many prediction pages and data feeds were built around MATIC and may lag updates. Always confirm the ticker and the underlying market (POLUSD vs MATICUSD vs POLUSDT). TradingView’s POL pages help reduce confusion.
Why do 2030 and 2040 POL forecasts differ so much?
Some tools use fixed growth rates (producing smoother, lower paths), while others assume major adoption shifts (producing wider, higher ranges). Over long horizons, small assumption differences compound dramatically.
What’s the single biggest variable for POL long term?
Sustained real demand for Polygon’s network services (usage, fees, and durable developer adoption) tends to be more important than short-term sentiment—especially as emissions and incentive structures evolve.
Start your safe cryptocurrency journey now
Fast and secure deposits and withdrawals, OSL safeguards every transaction !
bits.moreAboutTopics
bits.moreAboutTopics
bits.home.latest
Trump Postpones Iran Strike, SEC Tokenized Stock Exemption Imminent, Crypto Funds See $1.07B Weekly Outflow
Trump postpones Iran strike. SEC to release tokenized stock exemptions. Crypto funds see $1.07B outflow while 30-year Treasury yields exceed 5%.
Trump Postpones Iran Strike, SEC Tokenized Stock Exemption Imminent, Crypto Funds See $1.07B Weekly Outflow
SEC’s “Innovation Waiver” Launch: The Implications of Unilateral Stock Tokenization
SEC launches Innovation Waiver allowing third parties to tokenize stocks like Apple and Amazon without issuer consent. Explore RWA and DeFi impacts.
SEC’s “Innovation Waiver” Launch: The Implications of Unilateral Stock Tokenization
Ethereum Drops to $2,100: Analyst Tom Lee Cites Surging Oil Prices as Key Driver of Selling Pressure
Tom Lee links Ethereum's drop to $2,100 to surging oil prices. Learn why ETH correlates with crude and its long-term RWA potential.
Ethereum Drops to $2,100: Analyst Tom Lee Cites Surging Oil Prices as Key Driver of Selling Pressure
Middle East Tensions Trigger Flash Crash: BTC Drops Below $77,000 as $500M Liquidated in One Hour
Middle East tensions trigger a massive crypto flash crash. BTC falls below $77k with $500M+ in liquidations. Analyze market trends and whale moves.
Middle East Tensions Trigger Flash Crash: BTC Drops Below $77,000 as $500M Liquidated in One Hour
Rate Hike Fears Spark Risk Asset Sell-off; Bitcoin ETFs See $635M Outflow as BTC Dips Below $80,000
Bitcoin drops below $80,000 as macro rate hike fears trigger a $635M spot ETF outflow. Experts view this as a healthy correction for long-term buyers.
Rate Hike Fears Spark Risk Asset Sell-off; Bitcoin ETFs See $635M Outflow as BTC Dips Below $80,000
bits.recommend.name
bits.moreAboutTopics
bits.moreAboutTopics
