LINK Crypto Price Outlook 2026-2040: Scenarios, Drivers, and Key Risks

Key Takeaways: LINK Price Predictions at a Glance
Third-party forecasts for LINK in 2026 cluster from the low teens to low-$30s, depending on methodology.
2030 projections diverge widely (from modest growth cases to triple-digit targets), reflecting big differences in adoption assumptions.
2040 ranges are highly speculative, spanning from double-digits to very large numbers in some publications. Treat these as illustrative scenarios, not actionable targets.
LINK’s long-run outlook is commonly tied to oracle demand, cross-chain messaging (CCIP), enterprise integrations, and broader crypto market cycles (and also to regulatory posture).
This article summarizes third-party opinions and public data; it is not investment advice.
What is Chainlink (LINK)?
2026 refresh: scenario framework and risk checks
This update reframes the article as scenario analysis rather than a single-point price forecast. Crypto price outlooks can change quickly, so readers should treat the numbers as directional context and verify market data before making decisions.
Scenario | What would need to happen | Key risk |
|---|---|---|
Bull case | Stronger liquidity, positive ecosystem catalysts, and broader risk-on sentiment. | Momentum can reverse quickly if liquidity weakens. |
Base case | Moderate adoption with price mostly driven by market beta and project-specific updates. | Sideways markets can reduce search and trading interest. |
Bear case | Macro weakness, token unlock pressure, regulatory stress, or security concerns. | Downside can be amplified in thin liquidity. |
Related reading: Bitcoin price outlook | Bitcoin as digital gold
Sources to verify during editorial review: CoinMarketCap market data | Official project documentation
FAQ: reading this price outlook
Is this a financial prediction?
No. It is a scenario framework based on public market context. It should not be read as investment advice or a guaranteed target.
What can invalidate the outlook?
Liquidity changes, token unlocks, protocol events, macro shocks, and regulatory developments can all invalidate prior assumptions.
Chainlink is a decentralized oracle network designed to connect smart contracts with data and systems outside the blockchain. In simple terms, most blockchains cannot natively access external information (like market prices, interest rates, or events in traditional systems). Oracles provide a way to deliver that information onchain so that smart contracts can execute based on real-world inputs.
Over time, Chainlink has expanded beyond price feeds into a broader set of services that analysts often group under “oracle” and “interoperability” infrastructure:
Data Feeds: Reference data used by DeFi protocols (e.g., pricing inputs for collateral and settlement logic).
Verifiable Random Function (VRF): Cryptographic randomness used in applications where outcomes must be provably fair.
Proof of Reserve (and related attestations): Mechanisms that can help protocols verify certain off-chain claims.
CCIP (Cross-Chain Interoperability Protocol): A messaging and token transfer framework intended for cross-chain applications.
From a market-analysis standpoint, Chainlink is frequently positioned as “infrastructure.” That framing can influence how third-party models approach the link crypto price prediction 2026-2030-2040 topic: instead of trying to model a single end-user product, analysts tend to focus on adoption breadth, integrations, and security assumptions.
What Typically Drives LINK’s Price Behavior?
LINK trades within the same global crypto market structure as other large-cap assets, so its price behavior can be influenced by broad drivers that are not unique to Chainlink:
Broader risk cycles and liquidity conditions: In risk-on periods, capital tends to flow into a wider range of assets and narratives like infrastructure and interoperability can gain traction. In risk-off conditions, correlations often rise and liquidity can tighten—especially during high-volatility events.
Narrative alignment with infrastructure themes: LINK is often discussed alongside themes such as DeFi activity, RWA/tokenization, and cross-chain connectivity. When those themes dominate market attention, infrastructure assets can see higher visibility. When focus shifts, attention and volume can rotate away.
Derivatives positioning and volatility mechanics: As with many actively traded assets, leverage and derivatives positioning can impact short-term volatility. This is one reason headline “predictions” can diverge sharply, even when they reference the same asset and timeframe.
For long-horizon readers searching link crypto price prediction 2026-2030-2040, the key takeaway is that near-term moves can reflect market regime and positioning as much as project-specific developments.
Tokenomics and Supply Structure
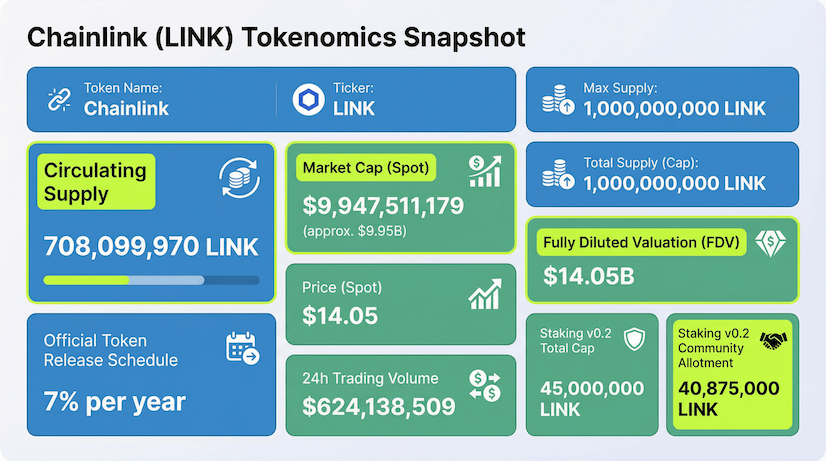
Tokenomics play a central role in framing any long-term discussion around price potential because they shape dilution expectations, liquidity availability, and implied valuation assumptions. Chainlink’s total supply is capped at 1,000,000,000 LINK, and public trackers distinguish between circulating supply and the remaining supply not currently in circulation.
In practice, analysts tend to focus less on the existence of a supply cap and more on how circulating supply changes over time, because that can influence:
market depth and liquidity,
implied valuation metrics such as fully diluted valuation (FDV),
and how “headline price targets” translate into market capitalization over multi-year horizons.
Chainlink also publishes details on its circulating supply context, including a stated token release schedule (presented as a percentage of total supply).
Staking
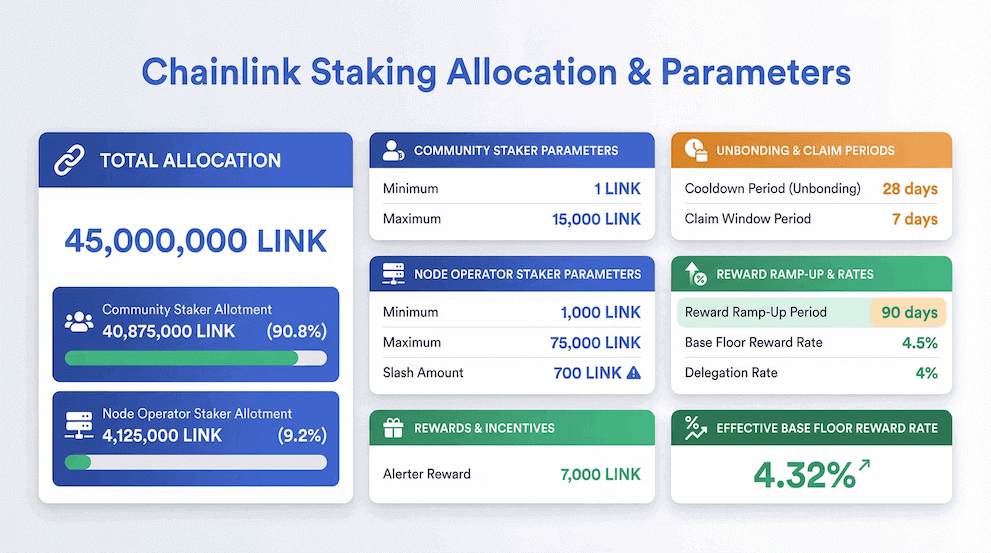
Chainlink’s staking is often discussed as part of its security and incentive design. Chainlink Staking v0.2 introduced an expanded staking cap (a fixed pool size) that third parties frequently cite when describing staking participation constraints.
From an analytical perspective, several tokenomic elements are particularly relevant when assessing long-horizon narratives such as link crypto price prediction 2026-2030-2040 and the current price.
Circulating supply vs total/max supply:
circulating supply determines what is actually tradable; max supply frames the upper bound of potential dilution.
Release dynamics and distribution:
changes in circulating supply can affect valuation expectations, particularly if demand growth does not keep pace.
FDV as context (not a forecast):
FDV can help contextualize how markets may think about valuation if supply approaches the maximum over time.
Market Capitalization as a “Reality Check” Lens
Many long-horizon discussions about link crypto price prediction 2026-2030-2040 focus on unit price (“LINK at $X”) and its implications for the chainlink network. A more grounded way to evaluate those statements is to translate a price level into an implied market capitalization, using circulating supply. This helps readers compare scenarios on a like-for-like basis and understand how supply assumptions can change the valuation math.
At the time of writing, CoinMarketCap lists Chainlink with a circulating supply of 708,099,970 LINK and a maximum supply of 1,000,000,000 LINK.
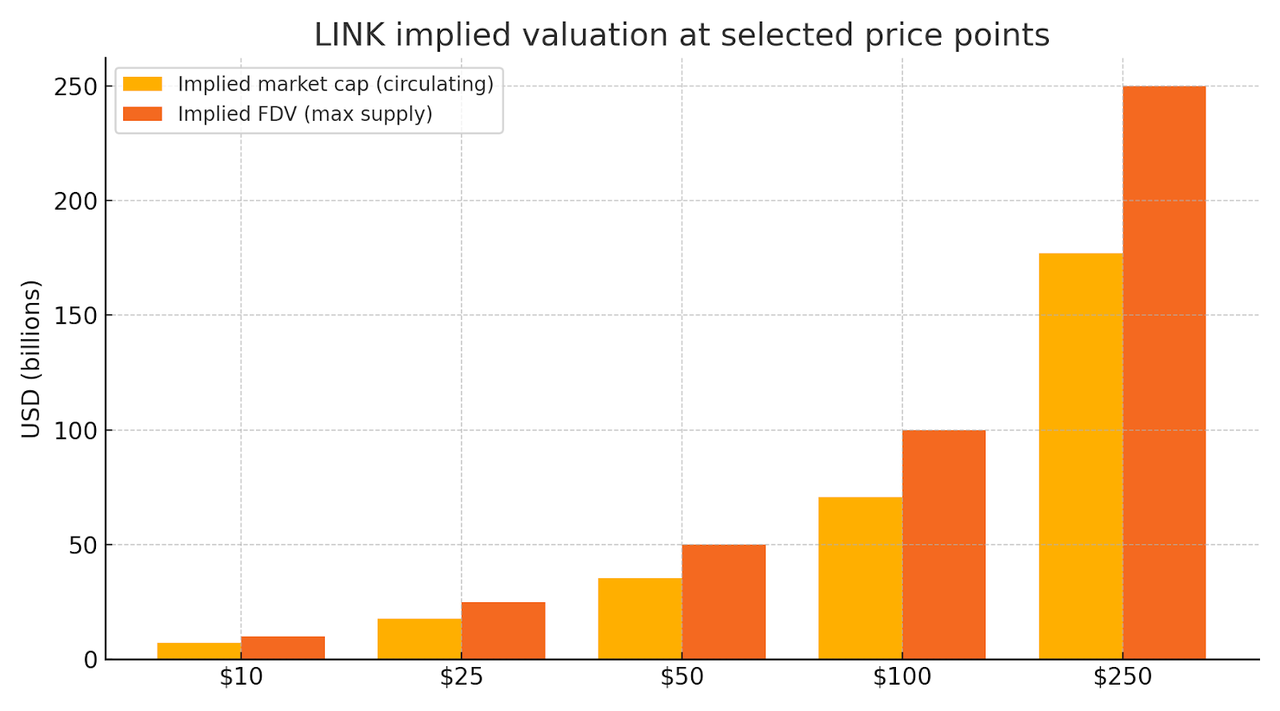
Illustration of implied market cap (based on circulating supply) vs implied FDV (based on max supply) at selected LINK prices. Sources: CoinMarketCap supply fields + Chainlink max supply cap.
Why this matters for 2026/2030/2040: a long-horizon “price target” implies a certain valuation scale based on chainlink price prediction. If the implied market cap becomes very large relative to the broader crypto market environment, then the scenario depends on much stronger assumptions about adoption, liquidity, and capital formation. Market-cap framing doesn’t say a scenario is “right” or “wrong”—it clarifies the magnitude of the assumptions.
LINK All-Time Price Performance
Chainlink (LINK) has shown classic crypto-cycle volatility: it recorded an all-time high around $52.7–$52.99 in May 2021, depending on the data source and timestamp conventions.
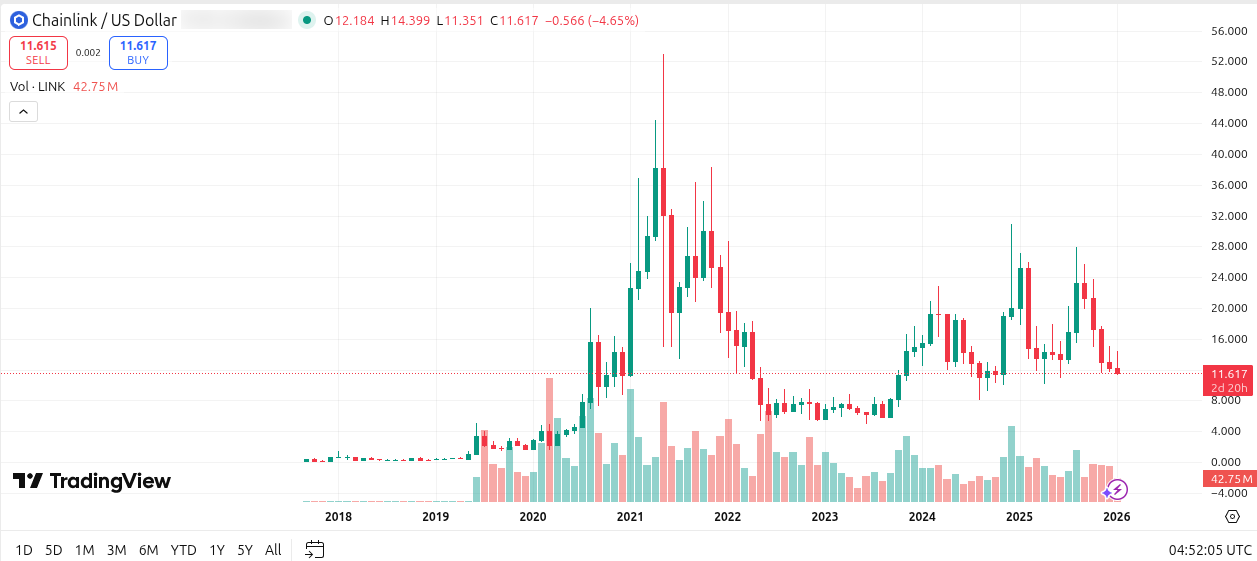
Source: TradingView chart
Note: Prices on different platforms can vary slightly due to index composition, venue selection, and timing. That’s normal for crypto reference data.
Scenario Definition + Forecast Summary Table
This LINK crypto price prediction 2026–2030–2040 overview is a synthesis of third-party forecast models and published outlooks. These are not OSL targets and should be read as scenario bands for the chainlink price.
How forecasts are typically produced (and why they differ)
Most online prediction websites rely on some mix of:Technical/quant models (trend + volatility + mean reversion)Assumption-driven narratives (e.g., “RWA tokenization grows fast, so oracle demand rises”)User-input tools (results depend on what the reader enters; not a house view on chainlink price prediction)Because assumptions vary, long-range numbers (especially 2040) can swing dramatically.
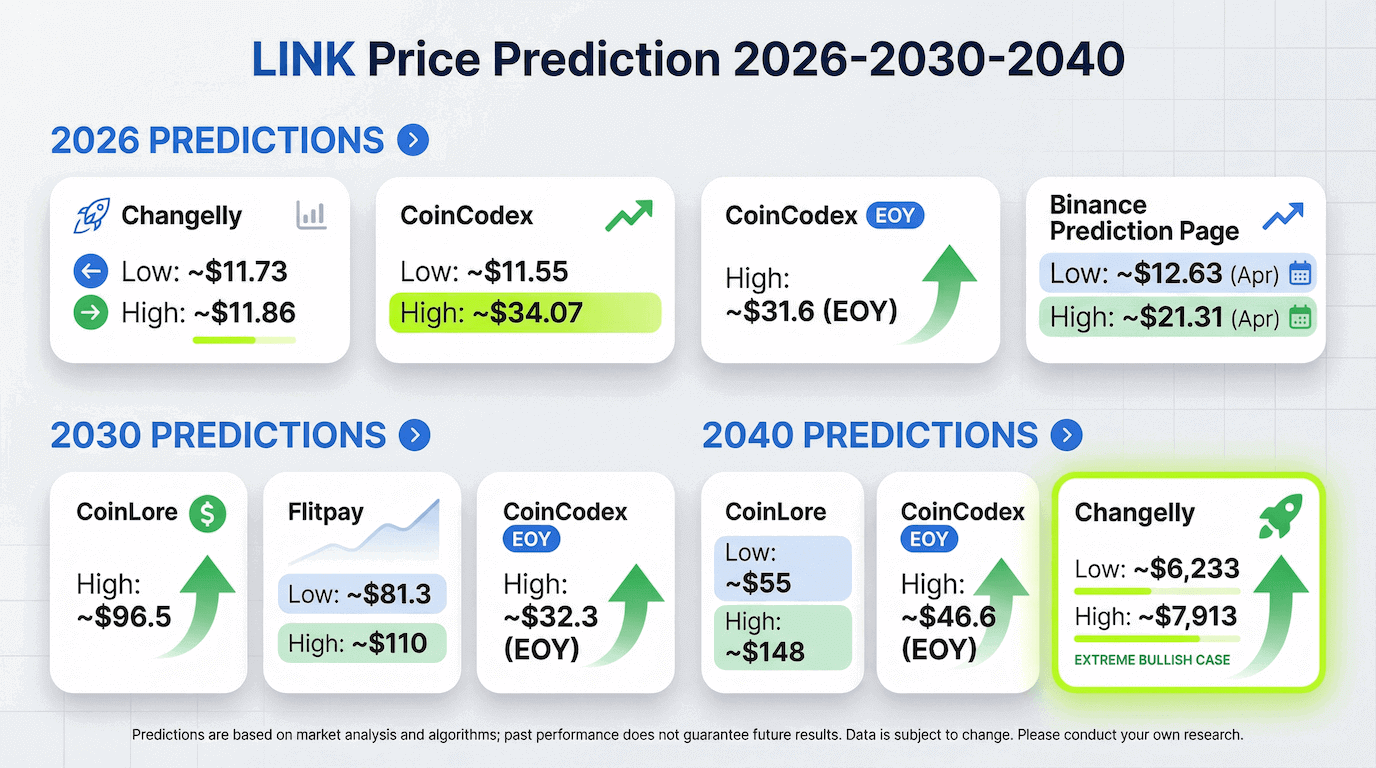
Summary table: third-party LINK forecasts
Year | Source | Low | High | Approach |
|---|---|---|---|---|
2026 | Changelly | ~$11.73 | ~$11.86 | Monthly-style “expert” forecast around current levels |
2026 | CoinCodex | ~$11.55 | ~$34.07 | Model range; upper bound implies strong rebound |
2026 | CoinCodex (EOY) | — | ~$31.6 (EOY) | End-of-year estimate (single point) |
2026 | Binance prediction page | ~$12.63 (Apr) | ~$21.31 (Apr) | Short-horizon/month slice example |
2030 | CoinLore | — | ~$96.5 | Referenced by Axi as a 2030 outlook |
2030 | Flitpay | ~$81.3 | ~$110 | RWA-led narrative range |
2030 | CoinCodex (EOY) | — | ~$32.3 (EOY) | Conservative end-of-year estimate vs other sources |
2040 | CoinLore | ~$55 | ~$148 | Model range (long horizon) |
2040 | CoinCodex (EOY) | — | ~$46.6 (EOY) | Another conservative long-horizon estimate |
2040 | Changelly | ~$6,233 | ~$7,913 | Extremely bullish long-horizon forecast (highly speculative) |
How to read this table: treat it as a map of market opinions, not a single “correct” answer. When forecasts conflict, the practical takeaway is which drivers each forecast depends on (adoption, revenue capture, market cycles, and regulation).
LINK Price Outlook for 2026
For 2026, you can think in terms of LINK’s potential to reach an average price that reflects market sentiment. bear/base/bull scenario bands, anchored to what third-party sources currently publish:1
Bear case (range: low teens)
A number of model-driven or near-term pages keep LINK in the low-teens range under conservative assumptions (slow growth, weak risk appetite, or prolonged consolidation). Examples include CoinCodex’s lower band and Changelly’s January 2026 window.
What would align with this scenario
Macro risk-off environment (tight liquidity, weak altcoin cycles)
Slower-than-expected traction for new oracle services or cross-chain messaging
Regulatory tightening that reduces speculative flow
Base case (range: mid-teens to low-$20s)
Some near-term forecast slices put LINK in a mid-teens to low-$20s band for 2026 time windows, depending on the month and assumed market trend.
What would support a base case
Continued use of Chainlink feeds across DeFi and stablecoin-related applications
More visible enterprise adoption proof points (but not a full “supercycle”)
Bull case (range: high-$20s to low-$30s)
CoinCodex’s higher range and end-of-year estimates imply upside into the upper-$20s/low-$30s under favorable conditions.
What would support a bull case
Strong crypto market cycle + better liquidity for majors
Measurable usage expansion for products frequently discussed in bullish narratives (e.g., broader CCIP adoption, new data streams, more on-chain settlement pilots)
LINK Price Outlook for 2030
By 2030, forecasts spread out substantially.
Why 2030 predictions diverge
Some sources frame Chainlink as core infrastructure for tokenization and data verification, pushing higher scenarios (often $80–$110 or more). Other model-based projections remain far more conservative (for example, CoinCodex’s end-of-year number around the low-$30s).
Scenario framing
Bear case (range: $20–$40): Assumes steady relevance but limited value capture and/or muted altcoin cycles (closer to conservative models), where the price could fluctuate based on market sentiment.
Base case (range: $50–$110): assumes measurable growth in oracle + cross-chain messaging demand and broader “real-world” integration (common in narrative forecasts).
Bull case (range: $150+): Appears in some publications referencing aggressive assumptions about tokenization scale and enterprise adoption, which could affect price prediction 2026. Treat as high uncertainty.
Key assumptions to watch
Whether oracle services become “must-have rails” for tokenized assets at scale (and whether LINK captures that value).
Liquidity and market structure: deep venues, tighter spreads, and institutional participation.
Regulation: clearer rules can enable more institutional usage, while fragmented rules can slow adoption
LINK Price Outlook for 2040
2040 forecasts are the most speculative. You’ll see:
Moderate long-horizon ranges (e.g., a few dozen to ~150) from some model sites.
Very large numbers from certain publications (thousands of dollars), which typically assume decades of compounding adoption and sustained dominance.
A practical way to interpret 2040 projections is not “Will it hit X?” but: What conditions would need to be true for oracle networks to justify extreme valuations? That includes long-term enterprise demand, credible revenue capture, robust security, and a regulatory environment that supports broad digital asset usage.
Warning: a 2040 number is not a target. It is a scenario illustration built on assumptions that are likely to change multiple times over 15 years.
LINK Metrics to Watch Checklist
If you want to track whether LINK’s real-world trajectory is aligning with a given scenario band, focus on measurable indicators:
Network usage and demand signals
Growth in on-chain applications using Chainlink data feeds is expected to influence the price of LINK.
Usage trends of cross-chain messaging and interoperability tooling (often cited as a key driver in bullish outlooks)
Security and reliability
Incidents, downtime, or oracle manipulation events (or lack thereof)
Expansion of high-integrity data streams and verifiable data products (often discussed in adoption narratives)
Institutional and enterprise integrations
Announced pilots and production integrations with regulated financial entities (watch for substance: production usage vs announcements)
Token distribution and supply dynamics
Circulating supply changes and broader market liquidity conditions (use reputable trackers for supply and market cap context).
Regulatory developments
Rules affecting token custody, trading venues, stablecoins, and on-chain settlement—especially in major hubs like Hong Kong, the EU, the US, and Singapore.
From LINK Insights to Practical Access with OSL
Price scenarios are only one part of a disciplined digital asset approach. For many market participants, the bigger question is how to access and custody assets under strong controls.
OSL is Asia’s leading stablecoin and digital‑asset trading and infrastructure provider, backed by up to US$1 billion in insurance coverage. At OSL, users can trade LINK through institutional-grade market services, hold it in insured custody, and integrate it into broader, rules-based portfolios, subject to applicable regulations.
LINK is available on OSL through Flash Trade, a simplified trading service that allows users to buy, sell or convert supported tokens with zero trading fees. All transactions are executed at a quoted price that can be reviewed before confirmation. You can access LINK trading directly on our LINK/USD Flash Trade page. Flash Trade is designed to complete transactions in just three steps:
Buy LINK
Select LINK and pay with USD.
Enter either the USD amount you want to spend or the amount of LINK you want to buy.
Review the quote and confirm the trade.
FAQs on LINK Crypto Price Predictions
Will Chainlink reach $100 by 2030?
Some third-party articles frame $100 as possible under strong adoption and favorable market cycles, but it depends on multiple variables (macro liquidity, actual enterprise usage, and market structure). Treat it as a bull scenario, not a base expectation.
How much will 1 LINK be worth in 2030?
Published 2030 estimates vary widely: some forecasts cluster around ~$80–$110, while others are much more conservative (or much higher). The spread mainly reflects different assumptions about long-term adoption and LINK’s value capture.
What is LINK used for (and why does that matter for forecasts)?
LINK is generally discussed as the token used within Chainlink’s ecosystem, which many sources describe as infrastructure connecting smart contracts to external data and services, potentially influencing its average price. Forecast narratives often assume that broader adoption of these services increases demand for the network over time.
Why do 2040 LINK predictions vary so much?
Long-horizon forecasts can range from double-digits to very large numbers because they rely heavily on assumptions about decades of growth, regulation, market cycles, and whether Chainlink remains a dominant standard. Small changes in assumptions compound into huge differences by 2040.
Start your safe cryptocurrency journey now
OSL | Secure Ramps. Trusted Rails !
More topics
More topics
Latest
Visa and Mastercard Take Action on the Same Day: Why Have Stablecoins Become the Winners in AI Payments?
Visa and Mastercard announced AI-powered payment solutions on the same day, both designating stablecoins as key settlement channels. This article analyzes why stablecoins are the most suitable native settlement layer for AI payments.
Visa and Mastercard Take Action on the Same Day: Why Have Stablecoins Become the Winners in AI Payments?
Zero to $500 Million in Four Months: Inside the USDGO Enterprise Stablecoin
USDGO, a compliance-first enterprise stablecoin, hit $500M in four months. How its dual-licence design and payment stack solve cross-border B2B costs.
Zero to $500 Million in Four Months: Inside the USDGO Enterprise Stablecoin
Stablecoins Aren't Instant or Free: Where the Real Costs Hide
Stablecoin transfers are fast and cheap on-chain, but the real costs hide at the on-ramp and off-ramp. Where stablecoin payments actually win, and don't.
Stablecoins Aren't Instant or Free: Where the Real Costs Hide
Why Compliance Won: The Quiet Death of Algorithmic Stablecoins
Stablecoins come in three types, but only fiat-backed ones survived. How a $50B collapse and global regulation turned compliance into the real moat.
Why Compliance Won: The Quiet Death of Algorithmic Stablecoins
USDT vs USDC: Inside the Stablecoin Duopoly That Controls 82% of the Market
USDT and USDC control over 82% of the stablecoin market. Here's how the two coins differ and why new entrants keep failing to break the duopoly.
USDT vs USDC: Inside the Stablecoin Duopoly That Controls 82% of the Market
From $135 to $225 and Back in a Week: Is SPCX a Classic Case of "Low Float, High FDV"?
Analyze SPCX stock's 50% surge and reversal. Learn why its low float, high FDV structure mirrors crypto tokens and what future unlocks mean for price.
From $135 to $225 and Back in a Week: Is SPCX a Classic Case of "Low Float, High FDV"?
Recommended for you
More topics
More topics
