The Great Decoupling: Why Bitcoin's Dance with the Dollar Index Changed in 2026
Apr 25, 2025
For over a decade, traders have relied on a simple rule: a strong U.S. dollar means a weak Bitcoin. This inverse relationship was a cornerstone of crypto market analysis. But 2026 has shattered this old paradigm. In early March, as the U.S. Dollar Index (DXY) climbed to a three-month high of 99.4, Bitcoin didn’t just hold its ground—it soared past $72,000. This unprecedented decoupling, where both the safe-haven dollar and the premier risk asset rallied in tandem, signals a fundamental shift in market structure. What is driving this change, and how must investors adapt their strategies in this new era? This article dives into the 2026 data to explain why the old rules no longer apply.
What is the U.S. Dollar Index (DXY) & Why Did It Historically Matter?
The U.S. Dollar Index (ticker: DXY) is a crucial barometer for the U.S. dollar's strength on the global stage. It measures the value of the dollar against a weighted basket of six major foreign currencies: the Euro (EUR) with a 57.6% weight, the Japanese Yen (JPY) with 13.6%, the British Pound (GBP) with 11.9%, the Canadian Dollar (CAD) with 9.1%, the Swedish Krona (SEK) with 4.2%, and the Swiss Franc (CHF) with 3.6%. When the DXY rises, it signifies a stronger dollar, and when it falls, a weaker one.
The Traditional Inverse Correlation: A Safe-Haven Battle
Historically, the DXY and Bitcoin have moved in opposite directions. This inverse correlation stems from their competing roles in a global macroeconomic context. The U.S. dollar is the world's primary “safe-haven” asset. During times of economic uncertainty or geopolitical turmoil, investors tend to sell off “risk-on” assets like stocks and cryptocurrencies and flock to the perceived safety of the dollar, pushing the DXY higher. Conversely, when the Federal Reserve pursues expansionary monetary policies (like lowering interest rates), the dollar weakens, making alternative, non-yielding assets like Bitcoin—often dubbed “digital gold”—more attractive as a hedge against fiat currency debasement. This dynamic established a predictable pattern: a rising DXY was bearish for Bitcoin, while a falling DXY was bullish.
The Turning Point: Analyzing the 2026 Market Shift with Real Data
The market dynamics of 2026 have challenged the long-standing inverse correlation. As of March 16, 2026, while the DXY stood strong at 100.24, Bitcoin's price was approximately $73,812, showcasing a clear divergence from historical patterns. This shift is not an anomaly but a trend confirmed by multiple financial institutions.
Data Deep Dive: A Weakening Negative Link and a Positive Flip
Research from VanEck highlighted that the inverse correlation has been structurally moderating. The correlation coefficient (r²), which was a strong 0.7 between 2014 and 2020, has weakened to just 0.45 in the current cycle. More dramatically, a March 2026 analysis from JPMorgan confirmed that Bitcoin’s correlation with the dollar has flipped to positive for the first time since before 2014. This means that, for now, Bitcoin is moving more in line with the dollar rather than against it.
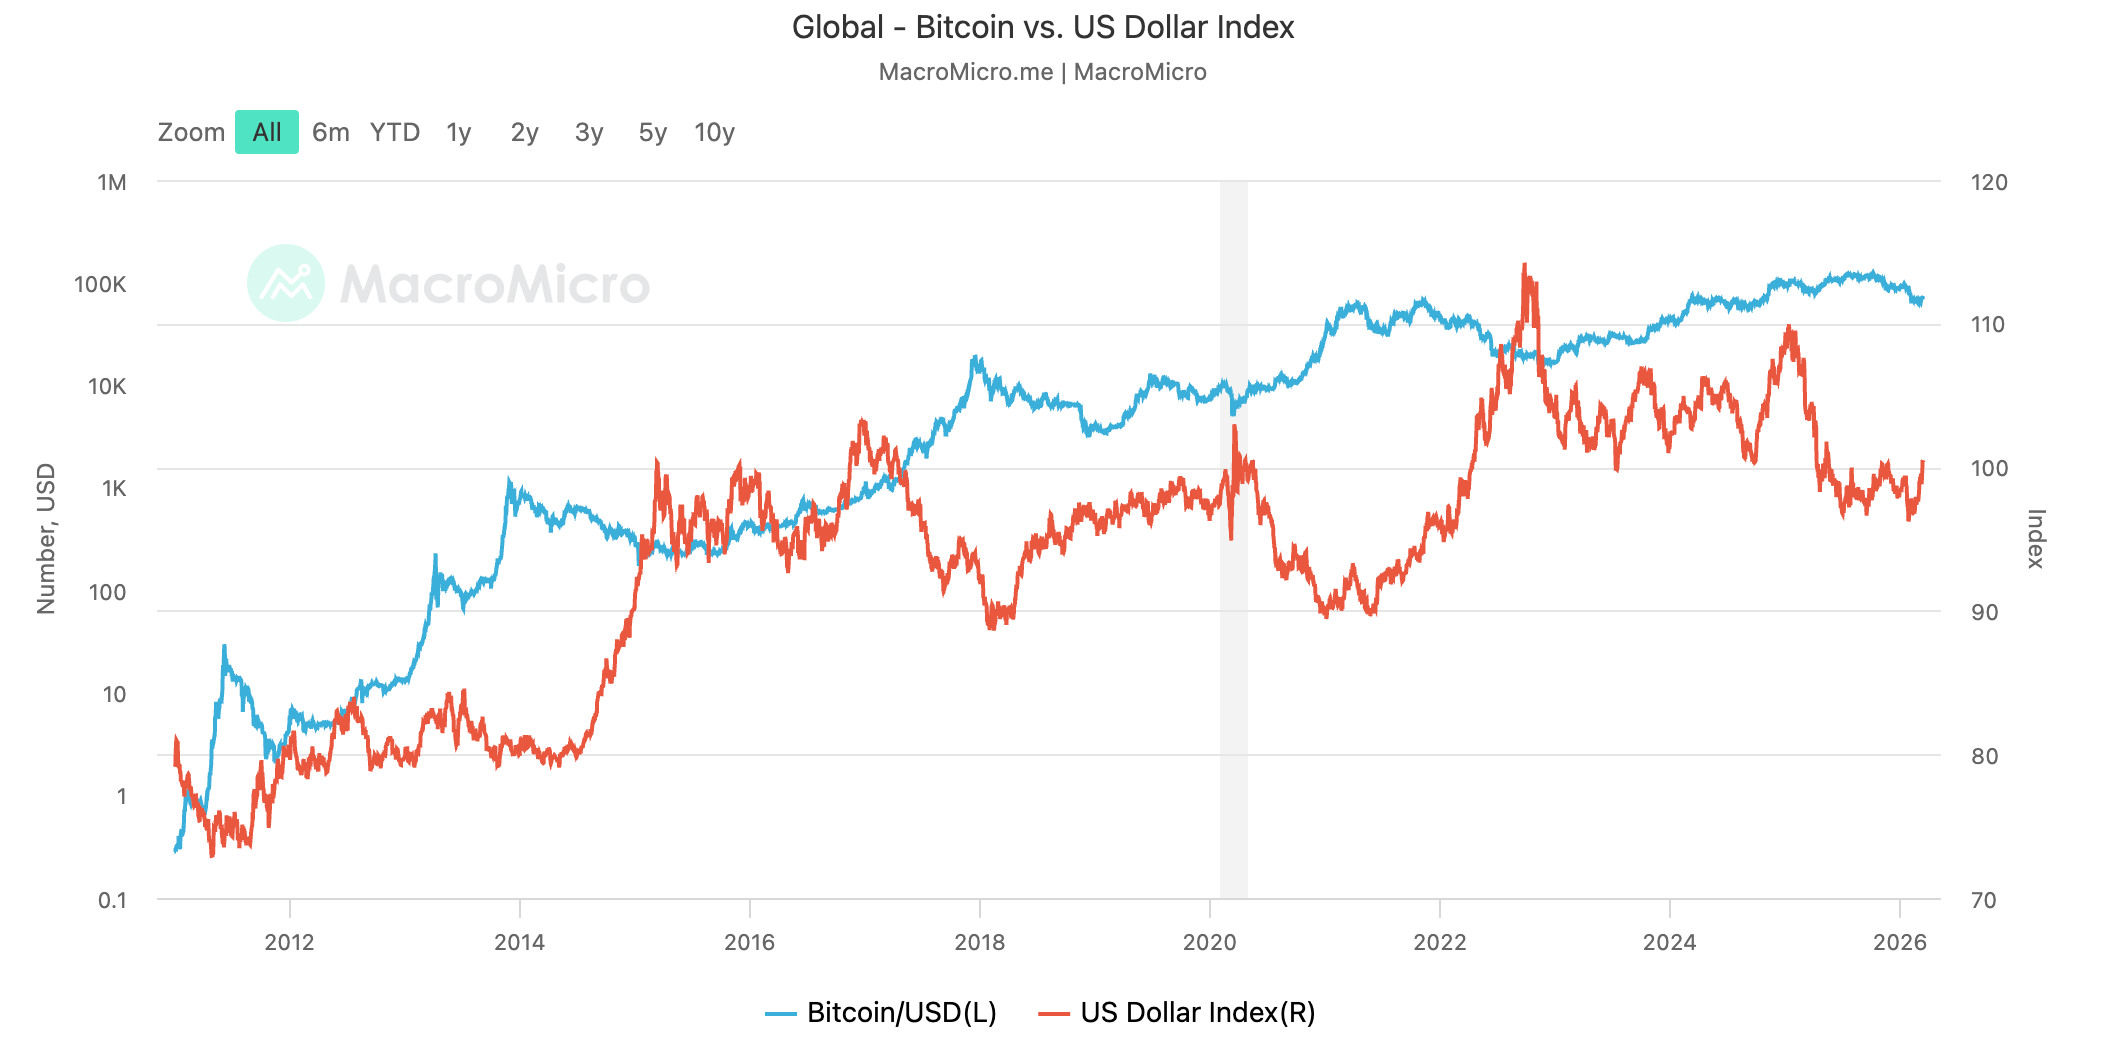
Source: MacroMicro, March 2026. The chart illustrates the historical inverse relationship and the recent decoupling.
The ETF Effect: How Institutional Flows Rewrote the Rules
The primary catalyst behind this decoupling is the massive influx of institutional capital through spot Bitcoin ETFs, launched in the U.S. in early 2024. These investment vehicles have fundamentally altered Bitcoin's market structure. Instead of being purely a retail-driven, risk-on asset, Bitcoin is now an institutionally-recognized store of value. When capital flows into the U.S. for safety, driving up the DXY, a portion of that capital now also finds its way into Bitcoin ETFs as a strategic allocation. For instance, despite a brief period of net outflows totaling around $4.5 billion in early 2026, major players like BlackRock's IBIT have continued to see dominant inflows, demonstrating persistent institutional demand that can override traditional macro pressures.
Historical Case Studies: DXY vs. Bitcoin in Bull and Bear Markets
To fully grasp the significance of the 2026 shift, it's crucial to examine how this relationship played out during recent major market cycles.
The 2022 Crypto Winter: A Classic Inverse Correlation Example
The 2022 bear market was a textbook illustration of the traditional DXY-Bitcoin dynamic. As the Federal Reserve embarked on an aggressive rate-hiking cycle to combat soaring inflation, global liquidity tightened. Investors shed risk assets and rushed to the safety of the U.S. dollar. Consequently, the DXY surged, climbing to a 20-year high above 114. This immense dollar strength created a brutal headwind for Bitcoin, which saw its price plummet from nearly $47,000 at the start of the year to a low of around $16,000. The inverse correlation was clear and punishing.
The 2024-2026 Bull Run: A New Paradigm Emerges
The period following the 2024 Bitcoin halving and the launch of spot ETFs painted a different picture. While the DXY experienced fluctuations, its influence on Bitcoin’s trajectory became less direct. For example, in January 2026, the DXY briefly dipped below 96, a level historically associated with a strong Bitcoin rally. While Bitcoin did see upward momentum, its price action was far more correlated with ETF inflow data. The most telling event occurred in March 2026, when a strengthening DXY failed to suppress Bitcoin's price, confirming that the market's primary driver had shifted from simple risk-on/risk-off sentiment to the structural demand from institutional buyers.
Practical Application: Leveraging DXY Insights on the OSL Platform
Understanding the evolving relationship between the DXY and Bitcoin is not just an academic exercise; it has direct practical applications for traders. As a licensed and regulated virtual asset platform, OSL provides the secure and compliant tools needed to act on these macro insights.
Using DXY as a Macro Indicator for Spot Trading
While the correlation has weakened, the DXY remains a vital macro-economic indicator. A sharply rising DXY (e.g., above 100) could still signal tightening global liquidity, suggesting a more cautious stance might be warranted. Conversely, a sustained fall in the DXY could indicate a risk-on environment, potentially favoring assets like Bitcoin. On the OSL platform, you can monitor these trends and seamlessly execute spot trades between fiat and virtual assets. Our easy-to-use fiat on-ramp and off-ramp services allow you to quickly move capital to position your portfolio according to your macro view.
Executing with Precision: OSL Flash Trade for Zero Slippage
In a market where large institutional flows can cause rapid price movements, execution quality is paramount. Once you have formed a view based on indicators like the DXY, OSL’s Flash Trade feature allows you to execute large-sized trades instantly at a locked-in price. This eliminates the risk of slippage—the difference between the expected price and the execution price—ensuring your strategy is implemented exactly as intended. This is particularly valuable when reacting to significant macro data releases that affect both the DXY and Bitcoin.
Conclusion: Navigating the New Normal
The relationship between the U.S. Dollar Index and Bitcoin has entered a new, more complex phase in 2026. The once-reliable inverse correlation has been disrupted, primarily due to the structural impact of institutional adoption via spot ETFs. While the DXY remains an indispensable tool for gauging global macro sentiment, it is no longer the sole predictor of Bitcoin's direction. Investors must now adopt a more nuanced approach, weighing the DXY's signals against the powerful undercurrent of institutional capital flows. In this evolving landscape, leveraging a secure, compliant, and feature-rich platform like OSL is more critical than ever to navigate the new normal and execute strategies with confidence.
Frequently Asked Questions (FAQ)
1. Has the inverse correlation between DXY and Bitcoin completely disappeared in 2026?
Not completely, but it has significantly weakened and even turned positive at times. According to a March 2026 JPMorgan analysis, the correlation flipped positive for the first time since before 2014. It's more accurate to say the relationship is now dynamic and heavily influenced by institutional ETF flows.
2. What is a key DXY level to watch for crypto traders in 2026?
While no single number is a magic bullet, many traders view a sustained DXY move above the 100 level as a potential indicator of tightening global liquidity, which could pose headwinds for risk assets. However, as seen in March 2026, strong institutional demand for Bitcoin can counteract this pressure.
3. How can I use this information on OSL?
You can use the DXY as a macro sentiment gauge. If you anticipate major shifts in the dollar's strength, you can use OSL’s compliant fiat on/off-ramp and spot trading services to adjust your virtual asset positions. For precise execution during volatile periods, OSL Flash Trade helps you lock in prices and avoid slippage.
Start your safe cryptocurrency journey now
OSL | Secure Ramps. Trusted Rails !


