What Do Long Wicks on Candlesticks Mean? A Detailed Guide to Reversal Patterns
If you've ever found yourself staring at a candlestick chart, you might have noticed some peculiar-looking candles: they have very short bodies but drag a long 'tail' or sport a slender 'lightning rod' on top. To experienced analysts, this isn't just random noise; it's the market speaking loudly. Many traders are trying to capture reversal signals: what secrets are hidden in the 'long wicks' of candlestick charts? In reality, these are not just simple patterns but the 'battle scars' left behind after intense struggles between bulls and bears.
Definition and Visual Identification of Long Candlestick Wicks
Simply put, a candlestick consists of a 'body' (the part between the opening and closing prices) and a 'wick' or 'shadow' (the thin line connecting the highest or lowest price to the body).
Imagine the body as the 'consensus' finally reached by bulls and bears, while the wick represents the 'territory' they fiercely fought over, where one side ultimately retreated. A 'long wick' typically refers to a wick that is at least twice the length of the body.
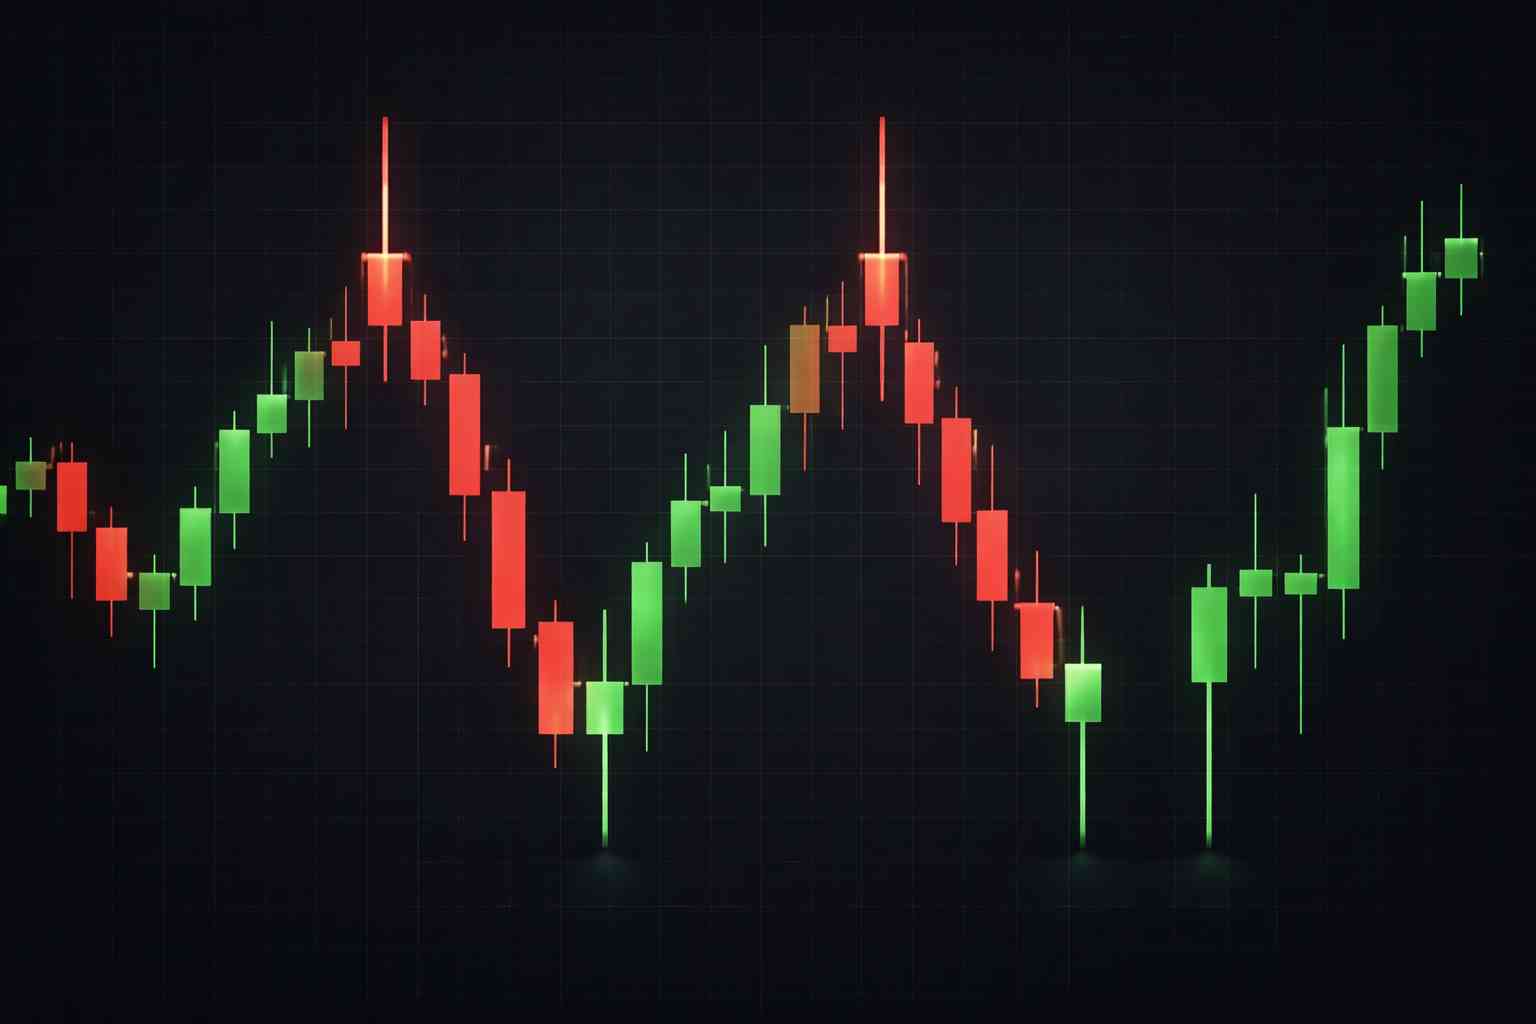
Long Upper Wick: Looks like an inverted thumbtack. It signifies that the price once surged high but was forcefully pushed back down.
Long Lower Wick: Looks like a hammer. It means the price once plummeted but was then strongly supported by buying pressure, reclaiming lost ground.
Visually, these long lines are like 'brake lights' from the market, signaling that the current trend may be encountering strong resistance or support.
The Bull-Bear Battle Behind the Wicks: How Market Sentiment Reverses
You might ask, why do long wicks appear? It's actually a micro-level psychological battle.
Think of the market as a tug-of-war. The appearance of a long wick represents one side (bulls or bears) launching a fierce attack, trying to pull the rope to their side (price fluctuates dramatically). But at a critical point, the opponent suddenly exerts force, not only blocking the attack but also yanking the rope back to near the starting point.
This phenomenon indicates that the force previously dominating the market is exhausting, while an opposing force is awakening. According to market behavior statistics from 2025, in high-volatility trading environments, approximately 63% of key trend reversals exhibited significant long-wick characteristics at their onset. When this pattern is confirmed by high trading volume, the predictive accuracy of sentiment reversal can even reach as high as 82%. This suggests that the longer the wick, the stronger the "rejection" in that direction, and the higher the probability of a subsequent sentiment reversal.
Detailed Analysis of Tops and Bottoms: Different Implications of Long Upper and Lower Wicks
Now that we know wicks represent 'rejection,' what do wicks in different directions signify? We can understand this through two vivid scenarios:
1. Long Upper Wick: The Shooting Star
Imagine throwing a ball at the ceiling; it hits the ceiling and quickly bounces back to the floor. A long upper wick usually appears at the end of an uptrend. It tells you: buyers tried to push the price to a new high, but sellers (bears) launched a major counterattack, completely suppressing the upward push. This is often interpreted as a topping signal, suggesting the price may be about to fall.
2. Long Lower Wick: The Hammer
This is like forcefully pushing a ball into water (price drops), but the buoyancy of the water (buying pressure) immediately pushes it back to the surface. If a long lower wick appears at the bottom of a downtrend, it means sellers tried to crash the price, but were met with strong buying from those looking for a bargain. This is often interpreted as a bottoming signal, suggesting the price may be about to rebound.
Practical Application: Capturing High-Probability Reversal Points with Support and Resistance
Although long wicks are useful, a common mistake beginners make is entering a trade immediately upon seeing a long wick. This is a misconception. A long wick itself is just a 'warning.' To turn it into a high-probability signal, it must be combined with 'geographical location'—that is, support and resistance levels.
Location Determines Value: A long wick appearing in the 'middle of nowhere' (with no support or resistance nearby) is often just market noise and has very little reference value.
Confluence at Key Levels: If a long lower wick forms right at a strong historical support level or on a long-term moving average, this 'double confirmation' signal has practical significance.
Here's a specific example: Suppose an asset's price has been correcting for two weeks and falls to the starting point of the previous rally (a strong support zone). At this point, a 'Hammer' candle with an extremely long lower wick appears on the chart. This is like the market conducting a 'stress test' on this support level, and the result proves the support is valid. Paying attention to a reversal opportunity at this point is far more reliable than guessing in mid-air.
Avoiding Traps: Differentiating True and False Breakouts and Risk Control
In crypto or financial markets, 'false signals' are everywhere. Sometimes, a long wick might just be a trap set by institutional players to 'stop hunt' (triggering retail traders' stop-loss orders).
How to differentiate?
Wait for Confirmation: Don't rush to judgment before the candle with the long wick has closed. A more prudent approach is to wait for the closing of the next candle. If a long lower wick is followed by a full-bodied bullish candle, that is a strong confirmation of a reversal.
Volume Verification: Observe the trading volume when the long wick forms. A long wick formed on 'low volume' might mean few market participants were involved, making the signal unreliable. Conversely, a long wick accompanied by 'huge volume' indicates a genuine transfer of funds occurred, making it more credible.
Trading Mindset: How to Integrate Long Wick Signals into Your Trading System
Finally, you need to understand that no technical pattern is 100% accurate. A long wick should not be the sole basis for your trades but should act as a 'filter' within your trading system.
A mature trader thinks like this:
Trend Assessment: What is the current major trend? (Trading with the trend is always easier than trading against it).
Signal Identification: Has a long wick appeared at a key level?
Risk-to-Reward Ratio: If I enter here and place my stop-loss at the extreme end of the wick, is my potential profit worthwhile?
By establishing such a logical loop, you are no longer blindly guessing market direction but are playing a game of probabilities. A long wick is like a road sign; it can't drive the car for you, but it can tell you there might be a sharp turn ahead.
To truly master these analytical skills, it is recommended to choose well-known, compliant, and regulated platforms for in-depth learning and demo trading. This allows you to slowly develop a feel for the language of candlesticks while ensuring your safety.
Start your safe cryptocurrency journey now
OSL | Secure Ramps. Trusted Rails !
More topics
More topics
Latest
How Businesses Can Manage Stablecoin Settlement Risk in Corporate Payments?
Businesses can reduce stablecoin settlement risk by treating settlement as a controlled workflow, not only as a token transfer. They should review the stablecoin issuer, reserves, redemption terms, counterparties,...
How Businesses Can Manage Stablecoin Settlement Risk in Corporate Payments?
What Makes a Stablecoin Institutional Grade?
A stablecoin may be considered institutional grade when enterprises can review its issuer, reserve transparency, governance, redemption assumptions, compliance controls, operational workflow and reporting evidence....
What Makes a Stablecoin Institutional Grade?
What Compliance Teams Should Review Before Using USDGO for Payments and Settlement?
Compliance teams should ask about USDGO's issuer, reserves, attestations, redemption assumptions, eligible users, supported routes, jurisdictions, onboarding, screening, recordkeeping, reporting, fees and exception...
What Compliance Teams Should Review Before Using USDGO for Payments and Settlement?
How Corporate Boards Can Review Stablecoin Risk Controls for Payments and Settlement?
To explain stablecoin risk controls to a corporate board, management should separate the asset, service route, counterparties, controls and reporting model. The board should see issuer and reserve review, eligibility...
How Corporate Boards Can Review Stablecoin Risk Controls for Payments and Settlement?
Why Stablecoin Compliance Matters for Corporate Payment Workflows?
Stablecoin compliance matters for corporate payments because payment teams must confirm the asset, counterparty, route, jurisdiction, approval process, screening, records and reconciliation controls before value...
Why Stablecoin Compliance Matters for Corporate Payment Workflows?
How Can Stablecoin Settlement Support Import and Export Businesses?
Stablecoin settlement can give importers and exporters an additional route for agreed cross-border trade obligations. A workable route begins with the sales contract and invoice: the parties must define the amount,...
How Can Stablecoin Settlement Support Import and Export Businesses?
Recommended for you
More topics
More topics
