Understanding Volume Delta: Unveiling the True Capital Flow Behind Candlesticks

Have you ever had this experience? You see a full-bodied bullish candlestick, assume an uptrend is confirmed, and excitedly jump in, only for the price to reverse the next second, leaving you trapped?
This isn't just your confusion. Most traders only focus on price movements (candlesticks) and total volume, ignoring the market's real driving force: who is actually taking the initiative? If candlesticks are the 'face' of the market, then what we're discussing today, 'Volume Delta,' is its 'substance'.
Learning to feel the market's pulse: how to use Volume Delta to gain insights into entry and exit points is like putting on a pair of X-ray glasses, helping you see through the surface of candlesticks to the real power struggle between bulls and bears.
What is Volume Delta? Say Goodbye to Blind Trading Based on Price Alone
Imagine walking into a bustling auction house. If you only look at the total transaction amount (regular volume), you only know that business was brisk. But it doesn't tell you whether it was because buyers were enthusiastically bidding up prices (aggressive buying) or sellers were desperately offloading their assets (aggressive selling).
Volume Delta was created to solve this problem. It doesn't just record how much was traded, but more importantly, 'how it was traded'.
Simply put, Volume Delta is the difference between aggressive buying volume and aggressive selling volume.
Positive Value (Green): Means aggressive buying pressure is stronger; buyers are aggressively 'hitting the ask'.
Negative Value (Red): Means aggressive selling pressure is dominant; sellers are aggressively 'hitting the bid'.
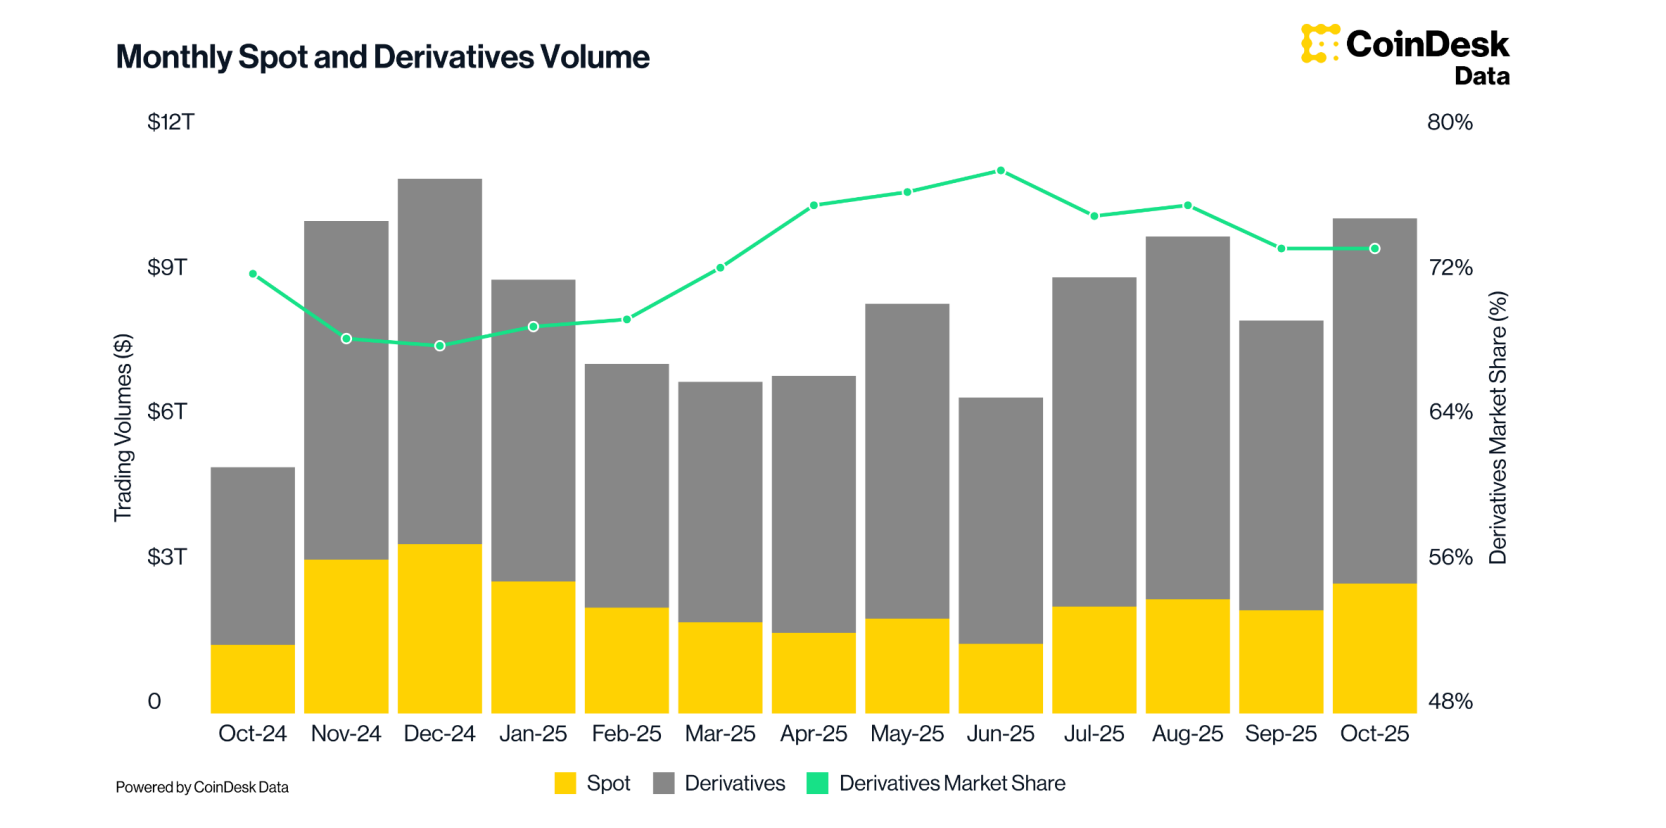
Industry Insights: According to the latest industry analysis reports from late 2025, as derivatives trading volume has surpassed 70% of total market volume, more than 75% of professional individual traders have moved away from lagging technical indicators and turned to real-time Order Flow analysis. Volume Delta, as a core tool for capturing "institutional footprints" and "retail momentum," has become the ultimate weapon for identifying true market sentiment.
Seeing Through the Bull-Bear Battle: The Working Principle and Core Logic of Volume Delta
To truly understand its power, we need to delve into the micro-level. At any given moment, there are two forces in the market:
Limit Orders: Like merchants at a stall, they set their prices and wait for others to buy or sell. They provide liquidity.
Market Orders: Like customers in a hurry, they want to transact immediately, regardless of the price. They consume liquidity.
Volume Delta captures the behavior of these 'customers in a hurry' (market orders).
Here's a vivid example: Imagine that within one minute, the price of Bitcoin doesn't change, and the candlestick is an insignificant doji. But when you look at the Volume Delta, you see a huge red bar. What does this mean? It means that although a large number of sellers were aggressively selling, they couldn't push the price down. Why? Because there were even stronger 'hidden' buyers (large limit orders) below, absorbing all the selling pressure.
This is what's known as passive absorption. If you only look at the candlestick, you'd think the market is quiet; but with Delta, you can hear the thunder beneath the iceberg.
Practical Application with Charts: How to Use Volume Delta to Precisely Capture Key Entry and Exit Points
Let's combine theory with practice and see how to use this indicator to aid decision-making on actual charts.
1. Verifying the Authenticity of a Breakout When the price breaks a key resistance level, you want to see a significantly positive Volume Delta. This indicates the breakout is driven by real, aggressive buying, not just short-sellers covering their positions. If the price makes a new high but the Delta is weak, it's often a signal of a 'false breakout,' also known as a 'bull trap'.
2. Identifying 'Absorption' and 'Distribution' This is one of the most valuable applications of Delta.
Bottom Absorption: The price is continuously falling or moving sideways at a low, but Volume Delta shows consecutive, large red bars (selling), yet the price fails to drop further. This suggests that large players are using the panic selling of retail traders to quietly build positions with limit orders.
Top Distribution: The price is rising or moving sideways at a high, and Volume Delta shows large green bars (buying), but the price fails to move higher. This indicates that although retail traders are buying aggressively, large players have placed huge sell limit orders above, distributing their holdings to those chasing the high.
3. The Key Technique Here: Don't just look at the color of the Delta; look at whether the Delta's value matches the price movement.
Advanced Application: Cumulative Volume Delta (CVD) and Price Divergence Patterns
If you add up the Delta value of each candlestick and plot it as a line, you get CVD (Cumulative Volume Delta). CVD is like the 'scoreboard' for the entire game, reflecting the medium to long-term trend of capital flow.
Using divergence between CVD and price is a secret weapon for many advanced traders looking for reversal points:
Bullish Divergence: The price makes a new low (Lower Low), but the CVD fails to make a new low, instead forming a higher low (Higher Low).
Interpretation: This suggests that selling pressure is exhausting. Although the price is still falling, fewer people are willing to sell aggressively, and the market may be about to reverse upwards.
Bearish Divergence: The price makes a new high (Higher High), but the CVD fails to make a new high and may even start to decline (Lower High).
Interpretation: This indicates that the price rise lacks the support of aggressive buying. It might be an empty rally driven by inertia or a lack of liquidity, and the risk of a downturn increases significantly.
This type of divergence is often more predictive than traditional RSI or MACD divergences because it is based directly on capital flow data, not lagging price calculations.
More Than Just Data: Common Pitfalls and Limitations of Using Volume Delta
Although Volume Delta is extremely powerful, it's not a crystal ball. To avoid the 'if all you have is a hammer, everything looks like a nail' problem, you need to be aware of the following pitfalls:
Don't Use It in Isolation: Volume Delta must be analyzed in conjunction with Market Structure and Key Levels. A Delta signal appearing in the middle of nowhere is less significant, but one appearing at a support or resistance level is invaluable.
Low Timeframe Noise: On very low timeframes (like 1-minute or second charts), Delta can be full of noise and deceptive signals. It's recommended for beginners to start observing on the 1-hour or 4-hour charts, where signals are more stable and reliable.
Differences Between Exchanges: The Web3 market is fragmented, and Delta data from a single platform may not represent the entire market. Professional tools now often provide 'Aggregated Delta,' which combines and analyzes trade data from major platforms, leading to more objective conclusions.
Conclusion: How to Build a Trading System Centered on Capital Flow
To survive in the treacherous market, feeling the market's pulse: how to use Volume Delta to gain insights into entry and exit points is a required course.
Volume Delta is not meant to replace your existing trading system, but to act as a powerful filter.
When your system gives a buy signal, glance at the Delta: Is it supported by aggressive buying, or are you the only one buying?
When you feel panicked and want to sell, check the Delta: Are people really dumping their positions, or are large players absorbing the supply with limit orders?
Starting today, try adding the Volume Delta or CVD indicator to your charts. No complex calculations are needed; simply by observing the interaction between the colors and the price, you can understand the market's intentions on a deeper level than others.
Remember, trading is a marathon. Continuous learning and objectivity are the keys to success. It is recommended to choose well-known, compliant educational platforms or simulation environments that offer advanced charting tools for practice. After truly understanding the logic of capital flow, you can then gradually build your own trading system.
Start your safe cryptocurrency journey now
OSL | Secure Ramps. Trusted Rails !
More topics
More topics
Latest
Why is Bitcoin Frequently Mentioned Near the "200-Week Moving Average"? Understanding This Long-Term Indicator
Discover the significance of Bitcoin's 200-week SMA, historical returns, and how to use technical indicators for long-term crypto investing.
Why is Bitcoin Frequently Mentioned Near the "200-Week Moving Average"? Understanding This Long-Term Indicator
Is This Panic Selling Only Half as Intense as Before? Analyzing Bitcoin Market Structure via On-chain Data
Analyze Bitcoin market structure using on-chain data. Learn why the recent sell-off's realized loss is half of the previous round.
Is This Panic Selling Only Half as Intense as Before? Analyzing Bitcoin Market Structure via On-chain Data
How Businesses Can Accept Stablecoin Payments: An Operational Guide
Learn how to accept stablecoin payments with OSL BizPay. A no-code guide for businesses to achieve fast, compliant, and low-fee global settlements.
How Businesses Can Accept Stablecoin Payments: An Operational Guide
2026 Comparison of Enterprise Cross-Border Stablecoin Payment Platforms: A Strategic Guide
Compare 2026 top stablecoin payment platforms: Circle, Stripe, BVNK, Zero Hash, and OSL BizPay. Find the best B2B cross-border solution for your business.
2026 Comparison of Enterprise Cross-Border Stablecoin Payment Platforms: A Strategic Guide
A Complete Guide to Cross-Border Payments: How Enterprises Manage Global Payables and Receivables
Learn how cross-border payments work and how stablecoin settlement offers faster, cheaper, and compliant global transactions for enterprises.
A Complete Guide to Cross-Border Payments: How Enterprises Manage Global Payables and Receivables
The Hidden Plumbing of Cross-Border Investing: Why "Compliant" Now Matters More Than "Convenient"
Discover why compliance is critical for cross-border investing with stablecoins. Learn about regulatory shifts, AML, and explainable fund trails.
The Hidden Plumbing of Cross-Border Investing: Why "Compliant" Now Matters More Than "Convenient"
Recommended for you
More topics
More topics
