Will Bonk Coin Reach $1? Market Analysis and Tokenomics

Bonk (BONK) is a community‑driven cryptocurrency and meme coin that has attracted significant attention since launching on the Solana blockchain in December 2022. Its rapid ascent in market capitalization and high trading volume have raised a fundamental question among observers and traders alike: will Bonk coin reach $1? Unlike typical assets with deep utility and established network effects, BONK’s valuation dynamics are influenced by factors such as supply structure, market sentiment, and broader crypto sector trends.
Below, we provide an objective analysis of these factors using publicly available data and third‑party market insights.
What is Bonk Coin?
Bonk is a meme cryptocurrency built on the Solana network, designed to resemble meme coins such as Dogecoin in culture and branding but leveraging Solana’s high throughput and low transaction costs. Its core identity is as a “community first” token with widespread distribution, including significant airdrops to Solana users, aimed at decentralizing its holder base.
While meme coins are often associated with speculative trading, BONK has sought to embed utility into the Solana ecosystem through integrations with decentralized apps (dApps), gaming platforms, and various DeFi protocols.
Current Price and Market Trends
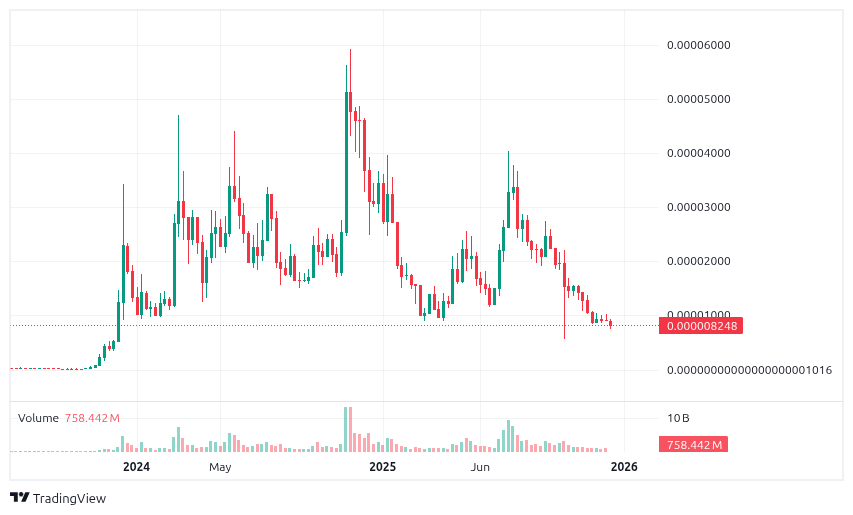
As of the latest data, BONK trades at a price far below $1 — in the order of a small fraction of a cent.The token’s price has exhibited typical meme coin volatility, with significant spikes and corrections over short periods. For example, BONK’s all‑time high of around $0.00005148 occurred near the end of 2024, followed by subsequent declines throughout 2025.
Market capitalization is influenced directly by circulating supply and token price: with a circulating supply above 82 trillion BONK tokens and a max supply close to 88.9 trillion, the market cap remains substantial despite the extremely low per‑token price.
Short‑term price movements are often driven by broader sentiment in the cryptocurrency markets, trading volume shifts, and speculation characteristic of meme coins. These dynamics can result in wide price swings that do not necessarily reflect underlying fundamental changes.
Tokenomics and Structural Barriers to $1
Tokenomic Metric | Value |
|---|---|
Circulating Supply | ~82.8 trillion BONK |
Max Supply | ~88.9 trillion BONK |
Current Price | ~$0.000008–0.00001 USD |
Market Cap | ~$700M–$800M USD |
Fully Diluted Value | ~$760M–$770M USD |
From a tokenomics perspective, the enormous supply is the most significant structural barrier preventing BONK from reaching a price level close to $1. If BONK were priced at $1 per token with the current circulating supply, the market capitalization would theoretically exceed hundreds of trillions of dollars, dwarfing the market values of major global equities or even national GDPs. This is a quantitative constraint that makes a $1 price mathematically implausible without radical changes to supply mechanics.
Many meme tokens incorporate burn mechanisms intended to reduce supply over time and therefore exert upward pressure on price. BONK employs such mechanisms, and burn events have occasionally coincided with short‑term rallies.While burns may marginally tighten supply over time, the scale required to materially alter the order‑of‑magnitude imbalance between supply and a $1 valuation is immense and would likely take many years, if it ever occurred.
Third‑Party Price Forecasts and Models
Market analysts and algorithmic forecast models from third-party research and data platforms can provide indicative ranges for BONK under different assumptions. These approaches typically rely on combinations of historical price behavior, momentum indicators, market liquidity, and broader sector conditions. It’s important to treat them as scenario tools rather than definitive outcomes—especially for meme coins, where sentiment shifts can dominate fundamentals.
For example, CoinCodex publishes BONK forecasts based on its model inputs (including trend and volatility assumptions) and typically presents range-based targets across multiple horizons rather than a single endpoint number. Notably, CoinCodex’s modeled ranges remain far below $1 in its forward-looking estimates, which aligns with the view that the current token supply makes a $1 outcome structurally difficult under ordinary market conditions.
Separately, long-form research pieces can provide a more explicit “market cap math” framing. Coin Bureau’s analysis breaks the question down into token supply, implied market cap at various price points, and what kinds of catalysts would be required for materially higher valuations. This type of research generally emphasizes that reaching $1 would likely require extraordinary conditions, for example, dramatic supply reductions and/or a market expansion well beyond historical precedent.
To complement forecast narratives with observable market signals, charting and indicator platforms can help readers contextualize current positioning. TradingView provides BONK price history, drawdowns, and technical indicator dashboards (moving averages, oscillators, pivot levels) that reflect how the market is trading today—useful for describing market structure without making directional claims.
Finally, data aggregators can provide near-term, market-condition commentary. CoinMarketCap’s BONK market pages and its CMC AI “price analysis/prediction” modules summarize recent moves, market sentiment indicators, and technical levels in an accessible format—helpful for discussing what is happening in the market now, while keeping the article descriptive rather than prescriptive.
Influential Factors That Could Affect Future Trajectory
Understanding whether BONK will achieve a particular price level requires analyzing the key drivers that may influence its trajectory over time:
Meme Coin Market Sentiment
Meme‑driven assets derive significant price momentum from social media hype and trading sentiment spikes. External narratives and retail interest cycles can catalyze rapid price movements, both up and down.
Integration and Ecosystem Utility
Expansion of BONK’s utility within the Solana ecosystem, such as gaming, NFTs, and DeFi applications, could contribute to broader adoption and usage beyond speculation.
Broader Crypto Market Trends
Macro trends in the cryptocurrency market, including Bitcoin and altcoin cycles, regulatory developments, and risk appetite among investors, often influence meme coin performance indirectly.
Token Supply Adjustments
Ongoing token emissions or burn events will continue to shape supply dynamics. However, the scale of changes required to meaningfully shift the price toward higher levels is not trivial given current supply figures.
Conclusion and Outlook
An objective analysis of Bonk’s price history, tokenomics, and forecast models suggests that a $1 price point remains highly unlikely under current supply and market structure. The sheer scale of BONK’s circulating and maximum supply creates a mathematical constraint that makes such a valuation implausible without profound alterations to tokenomics or unprecedented market conditions.
Short‑term price movements and third‑party forecast ranges reflect the speculative nature of meme coin markets, which can experience rapid shifts in sentiment and valuation independent of fundamental utility. While ongoing ecosystem integrations and community engagement contribute to sustained interest, the data, including supply, market cap, and historical price behavior, does not support a trajectory towards $1 at present.
Instead, a more realistic analytical framework focuses on understanding how BONK may perform relative to its current price and market cap under various market scenarios, rather than anchoring discussions around achieving a specific high‑and‑unlikely price target.
More topics
More topics


Latest
How Businesses Can Manage Stablecoin Settlement Risk in Corporate Payments?
Businesses can reduce stablecoin settlement risk by treating settlement as a controlled workflow, not only as a token transfer. They should review the stablecoin issuer, reserves, redemption terms, counterparties,...
How Businesses Can Manage Stablecoin Settlement Risk in Corporate Payments?
What Makes a Stablecoin Institutional Grade?
A stablecoin may be considered institutional grade when enterprises can review its issuer, reserve transparency, governance, redemption assumptions, compliance controls, operational workflow and reporting evidence....
What Makes a Stablecoin Institutional Grade?
What Compliance Teams Should Review Before Using USDGO for Payments and Settlement?
Compliance teams should ask about USDGO's issuer, reserves, attestations, redemption assumptions, eligible users, supported routes, jurisdictions, onboarding, screening, recordkeeping, reporting, fees and exception...
What Compliance Teams Should Review Before Using USDGO for Payments and Settlement?
How Corporate Boards Can Review Stablecoin Risk Controls for Payments and Settlement?
To explain stablecoin risk controls to a corporate board, management should separate the asset, service route, counterparties, controls and reporting model. The board should see issuer and reserve review, eligibility...
How Corporate Boards Can Review Stablecoin Risk Controls for Payments and Settlement?
Why Stablecoin Compliance Matters for Corporate Payment Workflows?
Stablecoin compliance matters for corporate payments because payment teams must confirm the asset, counterparty, route, jurisdiction, approval process, screening, records and reconciliation controls before value...
Why Stablecoin Compliance Matters for Corporate Payment Workflows?
How Can Stablecoin Settlement Support Import and Export Businesses?
Stablecoin settlement can give importers and exporters an additional route for agreed cross-border trade obligations. A workable route begins with the sales contract and invoice: the parties must define the amount,...
How Can Stablecoin Settlement Support Import and Export Businesses?
Recommended for you
More topics
More topics
